The table below shows the annual change in the average nominal wage and inflation rate since 2008. a. Compute the percentage change in real income for each year shown in the table. Instructions: In part a, round your answers to two decimal places. In parts b and c, enter your answers as a whole number. If entering a negative number, include a minus sign. Percentage Changes in Nominal Income and Prices
The table below shows the annual change in the average nominal wage and inflation rate since 2008. a. Compute the percentage change in real income for each year shown in the table. Instructions: In part a, round your answers to two decimal places. In parts b and c, enter your answers as a whole number. If entering a negative number, include a minus sign. Percentage Changes in Nominal Income and Prices

Chapter18: Introduction To Macroeconomics: Unemployment, Inflation, And Economic Fluctuations
Section: Chapter Questions
Problem 13P

Related questions
Question
100%
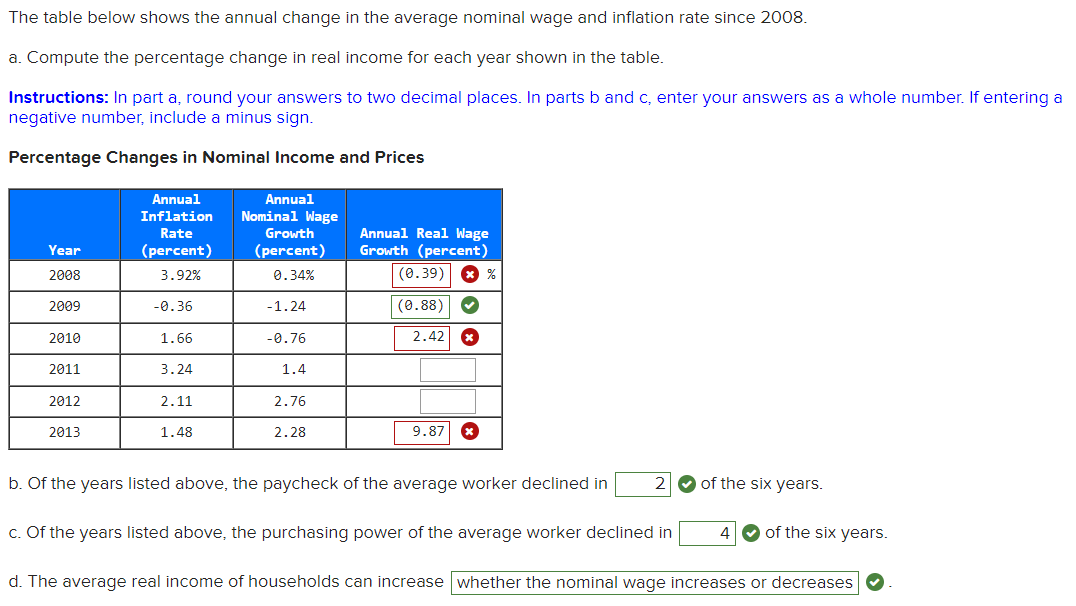
Transcribed Image Text:The table below shows the annual change in the average nominal wage and inflation rate since 2008.
a. Compute the percentage change in real income for each year shown in the table.
Instructions: In part a, round your answers to two decimal places. In parts b and c, enter your answers as a whole number. If entering a
negative number, include a minus sign.
Percentage Changes in Nominal Income and Prices
Year
2008
2009
2010
2011
2012
2013
Annual
Inflation
Rate
(percent)
3.92%
-0.36
1.66
3.24
2.11
1.48
Annual
Nominal Wage
Growth
(percent)
0.34%
-1.24
-0.76
1.4
2.76
2.28
Annual Real Wage
Growth (percent)
(0.39) x %
(0.88) ♥
2.42 x
9.87 x
b. Of the years listed above, the paycheck of the average worker declined in 2
c. Of the years listed above, the purchasing power of the average worker declined in
of the six years.
4 of the six years.
d. The average real income of households can increase whether the nominal wage increases or decreases
Expert Solution
This question has been solved!
Explore an expertly crafted, step-by-step solution for a thorough understanding of key concepts.

This is a popular solution!

Trending now
This is a popular solution!

Step by step
Solved in 2 steps

Knowledge Booster


Learn more about
Need a deep-dive on the concept behind this application? Look no further. Learn more about this topic, economics and related others by exploring similar questions and additional content below.Recommended textbooks for you
Exploring Economics
Economics
ISBN:
9781544336329
Author:
Robert L. Sexton
Publisher:
SAGE Publications, Inc

Brief Principles of Macroeconomics (MindTap Cours…
Economics
ISBN:
9781337091985
Author:
N. Gregory Mankiw
Publisher:
Cengage Learning

Essentials of Economics (MindTap Course List)
Economics
ISBN:
9781337091992
Author:
N. Gregory Mankiw
Publisher:
Cengage Learning
Exploring Economics
Economics
ISBN:
9781544336329
Author:
Robert L. Sexton
Publisher:
SAGE Publications, Inc
Brief Principles of Macroeconomics (MindTap Cours…
Economics
ISBN:
9781337091985
Author:
N. Gregory Mankiw
Publisher:
Cengage Learning
Essentials of Economics (MindTap Course List)
Economics
ISBN:
9781337091992
Author:
N. Gregory Mankiw
Publisher:
Cengage Learning

Principles of Economics 2e
Economics
ISBN:
9781947172364
Author:
Steven A. Greenlaw; David Shapiro
Publisher:
OpenStax


Principles of Macroeconomics (MindTap Course List)
Economics
ISBN:
9781305971509
Author:
N. Gregory Mankiw
Publisher:
Cengage Learning