10. Research found that students reported a Fall 2019 proportion of driving no more than 20 miles was 40%. Your sample of students indicated that 16 of 30 students drove no more than 20 mil per day. Research question: Is the reported Fall 2019 proportion significantly less than the Fall 2020 proportion? Be prepared to round final answers to hundredth place and to type Z or t table scores exactly as presented in the tables.
10. Research found that students reported a Fall 2019 proportion of driving no more than 20 miles was 40%. Your sample of students indicated that 16 of 30 students drove no more than 20 mil per day. Research question: Is the reported Fall 2019 proportion significantly less than the Fall 2020 proportion? Be prepared to round final answers to hundredth place and to type Z or t table scores exactly as presented in the tables.

Glencoe Algebra 1, Student Edition, 9780079039897, 0079039898, 2018
18th Edition
ISBN:9780079039897
Author:Carter
Publisher:Carter
Chapter10: Statistics
Section10.6: Summarizing Categorical Data
Problem 25PPS

Related questions

Question
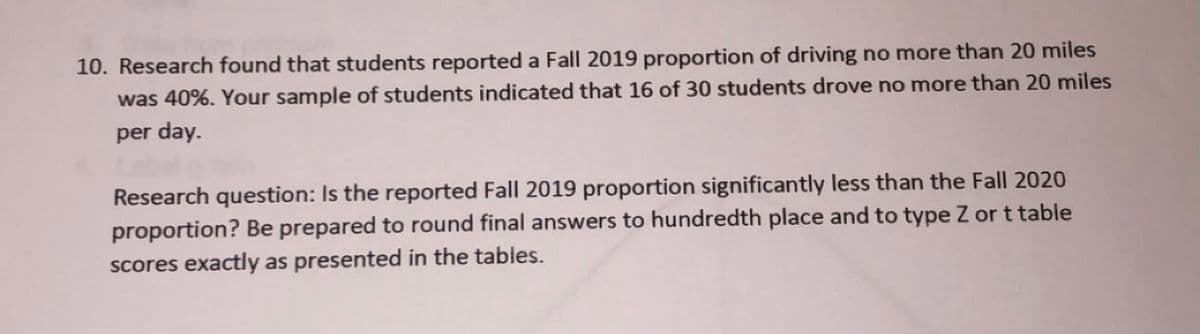
Transcribed Image Text:10. Research found that students reported a Fall 2019 proportion of driving no more than 20 miles
was 40%. Your sample of students indicated that 16 of 30 students drove no more than 20 miles
per day.
Research question: Is the reported Fall 2019 proportion significantly less than the Fall 2020
proportion? Be prepared to round final answers to hundredth place and to type Z or t table
scores exactly as presented in the tables.
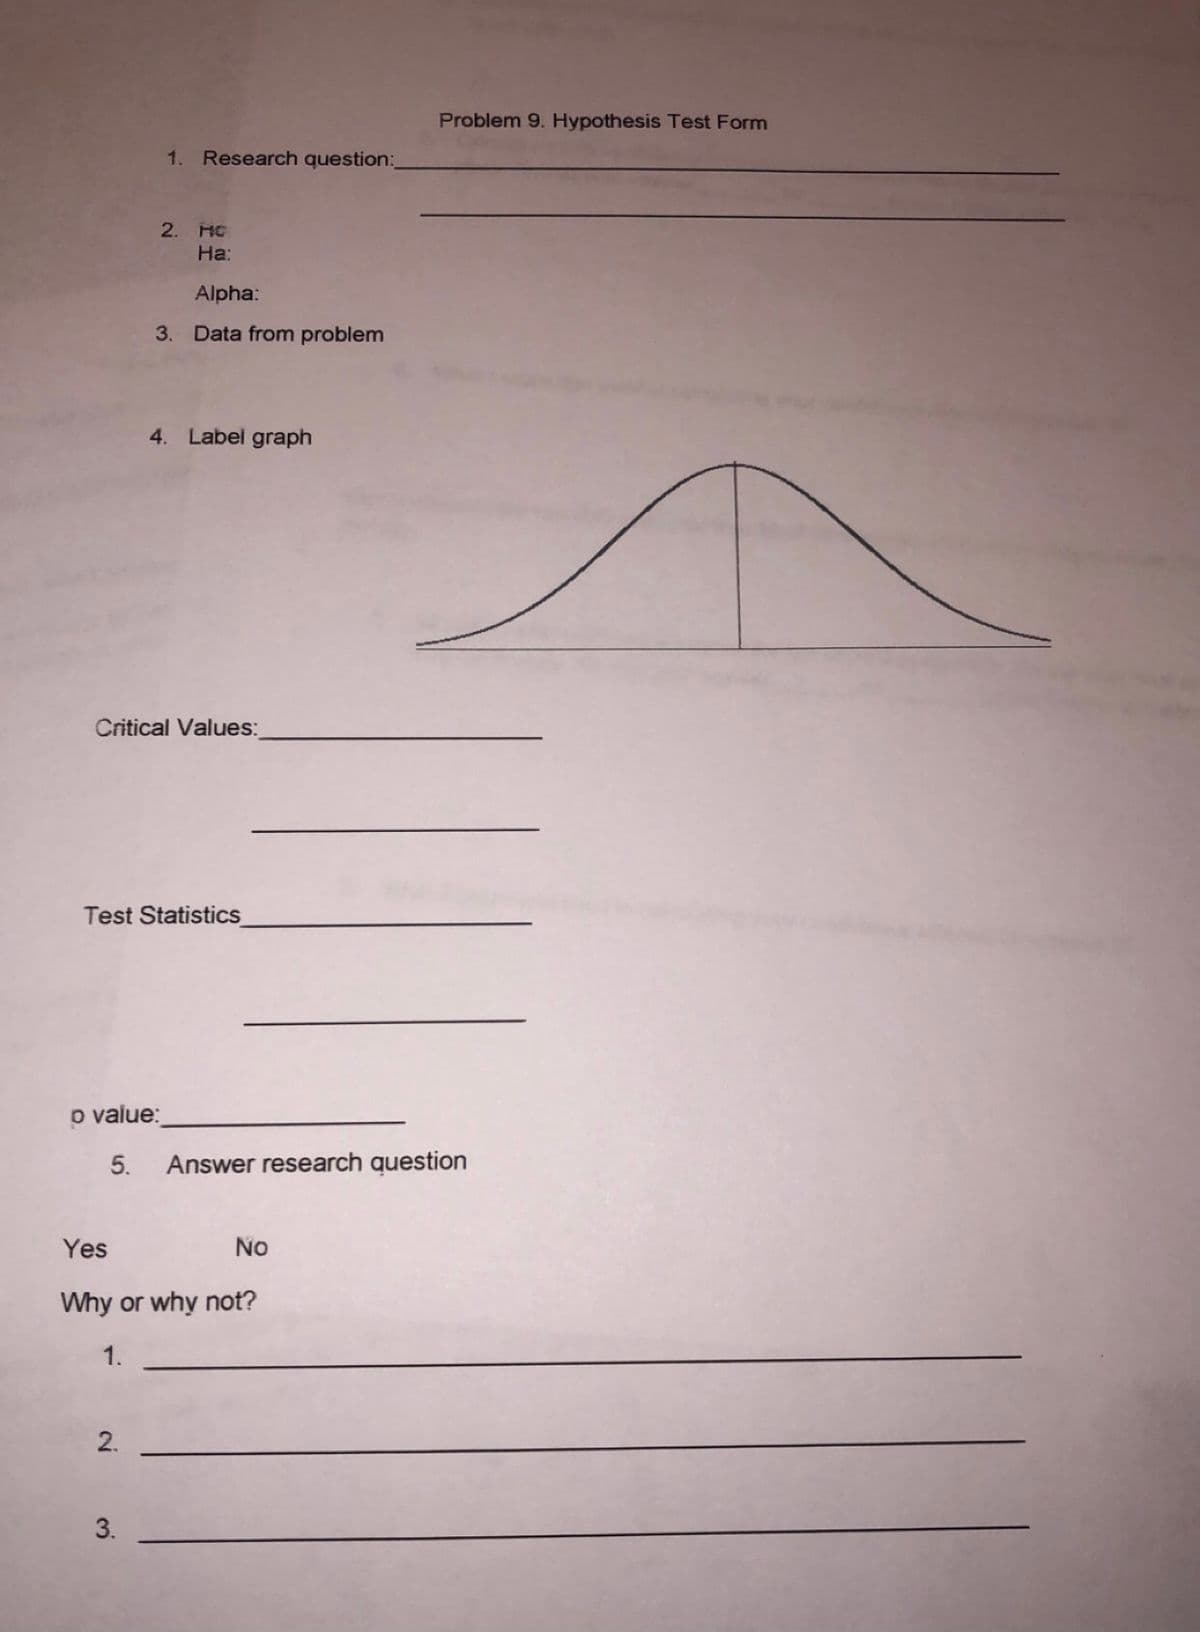
Transcribed Image Text:Problem 9. Hypothesis Test Form
1. Research question:
2. HC
На:
Alpha:
3. Data from problem
4. Label graph
Critical Values:
Test Statistics
o value:
5.
Answer research question
Yes
No
Why or why not?
1.
3.
2.
Expert Solution
Step 1
Given Information :
Research found that students reported a Fall 2019 proportion of driving no more than 20 miles was 40% . Your sample of students indicated that 16 of 30 students drove no more than 20 miles per day .
Research question : The reported Fall 2019 proportion significantly less than the Fall 2020 proportion .
The following information is provided: The sample size is , the number of favorable cases is , and the sample proportion is , and the significance level is
Null and Alternative Hypotheses
The following null and alternative hypotheses need to be tested:
This corresponds to a left-tailed test, for which a z-test for one population proportion needs to be used.

Step by step
Solved in 2 steps with 2 images

Knowledge Booster


Learn more about
Need a deep-dive on the concept behind this application? Look no further. Learn more about this topic, statistics and related others by exploring similar questions and additional content below.Recommended textbooks for you
Glencoe Algebra 1, Student Edition, 9780079039897…
Algebra
ISBN:
9780079039897
Author:
Carter
Publisher:
McGraw Hill
Glencoe Algebra 1, Student Edition, 9780079039897…
Algebra
ISBN:
9780079039897
Author:
Carter
Publisher:
McGraw Hill