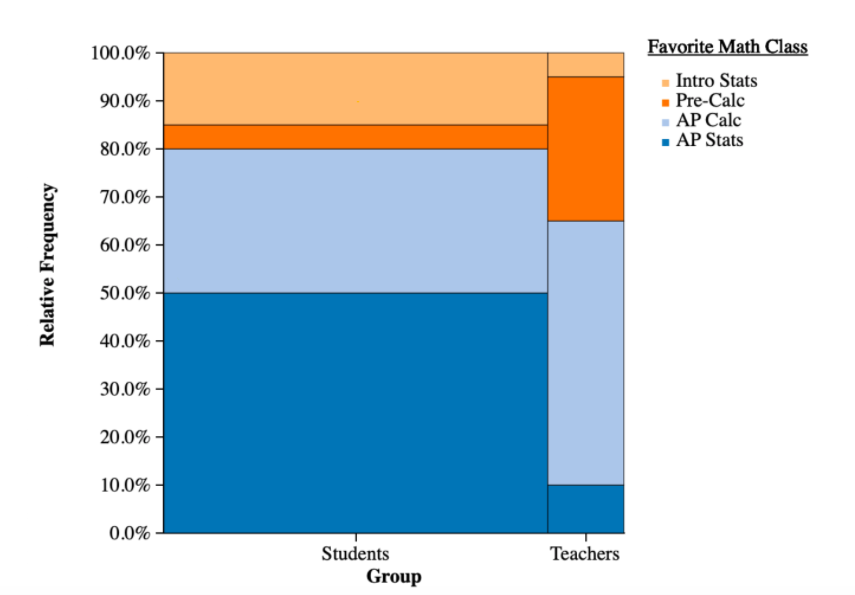
10. The mosaic plot shows the distribution of favorite math class for students and teachers at East Kentwood High School. Based on the graph, which of the following statements is true? (A) There are more teachers than students who chose their favorite math class as AP Calc. (B) 100% of students chose Intro Stats as their favorite math class. (C) When combining students and teachers, AP Stats has the highest overall proportion who chose it as their favorite math class.
10. The mosaic plot shows the distribution of favorite math class for students and teachers at East Kentwood High School. Based on the graph, which of the following statements is true? (A) There are more teachers than students who chose their favorite math class as AP Calc. (B) 100% of students chose Intro Stats as their favorite math class. (C) When combining students and teachers, AP Stats has the highest overall proportion who chose it as their favorite math class.

Glencoe Algebra 1, Student Edition, 9780079039897, 0079039898, 2018
18th Edition
ISBN:9780079039897
Author:Carter
Publisher:Carter
Chapter10: Statistics
Section10.6: Summarizing Categorical Data
Problem 10CYU

Related questions

Concept explainers
Contingency Table
A contingency table can be defined as the visual representation of the relationship between two or more categorical variables that can be evaluated and registered. It is a categorical version of the scatterplot, which is used to investigate the linear relationship between two variables. A contingency table is indeed a type of frequency distribution table that displays two variables at the same time.
Binomial Distribution
Binomial is an algebraic expression of the sum or the difference of two terms. Before knowing about binomial distribution, we must know about the binomial theorem.
Topic Video
Question
10. The mosaic plot shows the distribution of favorite math class for students and teachers at East Kentwood High School. Based on the graph, which of the following statements is true?
- (A) There are more teachers than students who chose their favorite math class as AP Calc.
- (B) 100% of students chose Intro Stats as their favorite math class.
- (C) When combining students and teachers, AP Stats has the highest overall proportion who chose it as their favorite math class.
- (D) 80% of students chose AP Calc.
- (E) There are more teachers than students at East Kentwood High School.
Expert Solution
This question has been solved!
Explore an expertly crafted, step-by-step solution for a thorough understanding of key concepts.

This is a popular solution!

Trending now
This is a popular solution!

Step by step
Solved in 2 steps

Knowledge Booster


Learn more about
Need a deep-dive on the concept behind this application? Look no further. Learn more about this topic, statistics and related others by exploring similar questions and additional content below.Recommended textbooks for you
Glencoe Algebra 1, Student Edition, 9780079039897…
Algebra
ISBN:
9780079039897
Author:
Carter
Publisher:
McGraw Hill

Holt Mcdougal Larson Pre-algebra: Student Edition…
Algebra
ISBN:
9780547587776
Author:
HOLT MCDOUGAL
Publisher:
HOLT MCDOUGAL
Glencoe Algebra 1, Student Edition, 9780079039897…
Algebra
ISBN:
9780079039897
Author:
Carter
Publisher:
McGraw Hill
Holt Mcdougal Larson Pre-algebra: Student Edition…
Algebra
ISBN:
9780547587776
Author:
HOLT MCDOUGAL
Publisher:
HOLT MCDOUGAL