7. What is the Mode in Figure 2? 8. Outliers are observations that are far from the other observations. How many children are outliers in Figure 3?
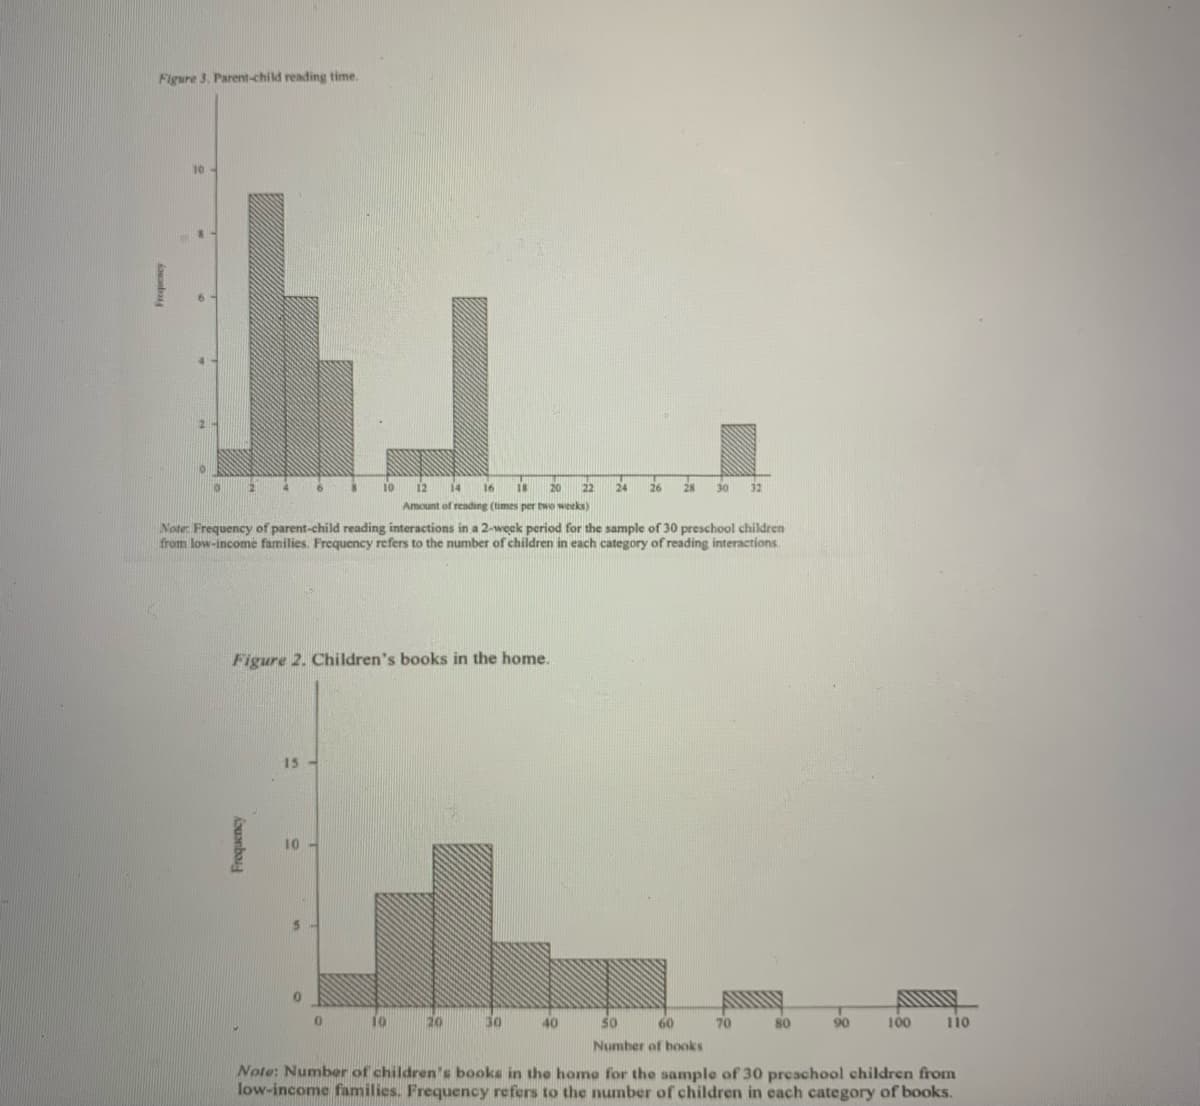
Q: Based on outliers and influencers, do you think the following scatter plots contain any outliers or…
A: Outliers: Data points that diverge in a large way from the overall pattern are called outliers.…
Q: Describe the shape, center, spread, and variability of the following graph with 74 subjects. Does it…
A: Uniform distribution is a continuous probability distribution. Here the distribution is also called…
Q: a. If a constant c is added to each xi in a sample, yielding yi = xi+ c,how do the sample mean and…
A: The sample mean of a dataset is computed by dividing the sum of the observations ∑x by the total…
Q: 4. A data set has a high value of 123 and a low value of 45. Do the data need to be grouped? What is…
A: 4. The maximum value in a data set is 123. The minimum value in a data set is 45. The data is needed…
Q: D. What is the IQR of the data E. What is the median of the data F. Are there any outliers? If…
A: Given data is in terms of percentage. Convert the data values in decimals by dividing by 100. Data:…
Q: 6. After calculating the relative frequencies for a frequency distribution, what should the sum of…
A: Since you have posted multiple questions, as per our guidelines we have provided answer for first…
Q: What method or sampling technique was used to conduct the experiment depicted in the graph(s)? (b)…
A: Given information: A graph that depicts the information of body tissue and turnover rate (in days)…
Q: In a moderately skewed frequency distribution mean is 50 and median is 53. If the coefficient of…
A:
Q: 39 students were asked their political orientation and to estimate the number of people making up…
A: The assumed observational point in the data set that is expected to be differing from the other…
Q: 33. What is the mean of the data set 25, 52, 55, 58, 59, 61, 63 and 80 if the outlier(s) is/are…
A:
Q: In a frequency distribution, the coefficient of skewness based on quartiles is 0.5. If the sum of…
A:
Q: The five number summary of a dataset was found to be: 1, 9, 13, 15, 18 An observation is considered…
A: Given 5 number summary 1, 9, 13, 15, 18 An observation is considered an outlier if it is below: 1
Q: If the five numbers summary of the data are : -14 , 0 , 2 , 3 , 10 then the lower outlier limit =
A: We have given that the data, 14, 0, 2, 3, 10 Then, We will find the lower outlier limit = ?
Q: the sticker prices ( in dollars) of 11 vehicles at a car dealership are listed 39144, 40872,…
A: Given information- We have given the sticker prices (in dollars) of 11 vehicles at a car dealership.…
Q: Which of the following measures of the center is more sensitive to outliers? (A) Mean (B) Median…
A: Measure of central tendency are used to measure the location value of the data set. There are five…
Q: (b) Which companies are outliers according to the 1.5 x IQR rule? Calculate the IQR, and 1.5 × IQR.…
A: Data is given about the revenues of different companies. Given data is:
Q: 13. Find the outliers in the given data set below. 2, 5, 31, 29, 40, 100, 39 (2 Points) O 100 O 2,…
A:
Q: For a box plot, here are 4 values at the low end of a dataset and 4 values near the high end of a…
A: Given: Data 2.7 5.5 6 9 … 50.5 54 60 65 Value 5 & 47
Q: Hello, 2 4 2 25 5 4 7 90 4 10 4 7 11 10 11 12 10 20 From the above data set - please calculate the…
A: We want to find Quartiltes( first, media, third), IQR, the inner fences, the outer fences, the max…
Q: For the following set of sample data: {10, 50, 60, 70, 75 79, 85, 90, 91, 95, 100, 110} What is the…
A: Here, number of data values are N=12. Then, AndQ3=3N2+12th value=3122+12th value=18+12th value=192th…
Q: 0 100 90 79 95 45 160 25 80 100 125 85 95 Are there any outliers?
A: arrange the given data in increasing order 25.,45,79,80,85,90,95,95,100,100,125,130,160…
Q: Determine whether the data has any outliers. If so, how many? Show your calculation or provide a…
A: The interquartile range is defined as: IQR = Q3 – Q1, where Q1 and Q3 are the first and third…
Q: How many students got more than 40 marks in mathematics? ii. How many students got between 60 and…
A: Cumulative frequency table is given : Total student = 1400 We have to calculate : 1: How many…
Q: What are outliers
A:
Q: For the following set of sample data: {10, 50, 60, 70, 75 79, 85, 90, 91, 95, 100, 110} What is the…
A: First Quartile, Q1= (n+1)/4 th term Here n= 12 = (12+1)/4th term = 13/4th = 3.25 =~ 3rd term = 60…
Q: The five number summary for a set of data is given below. Min Q1 Median Q3 Max 40 69 72 79 86 Using…
A: Given : Q1 = 69 Q3 = 79
Q: Give the meaning of an outlier. Does it affect the measures of central tendency? Give the meaning…
A: As we know Measures of central tendency are mean, median and mode.
Q: is an outlier?
A: a) Outlier: The Observation which lies outside the control limit is called an outlier. an outlier is…
Q: If IQR for the values: 79, 80, 25, 75, 69, .6 * ?110, 82 is 9, then determine the outlier(s)
A: given data
Q: The five number summary of a dataset was found to be: 2, 7, 9, 17, 18 An observation is considered…
A: From the given information we find the solution.
Q: Check for outliers
A: Outliers are the points in a dataset that does not follow the common trend of the data or greatly…
Q: A dentist is researching time spent teeth brushing. A sample of 13 brushing times is collected and…
A: An outlier is defined as being any point of data that lies over 1.5 IQRs below the first quartile…
Q: 1.(3) Calculate 10% trimmed mean. 2.(5) Calculate median, lower forth and upper forth, identify…
A: Answer:- First put the observations in an ascending order. 13,21,23,24,25,36,37,45,59,87 Here, n=10…
Q: What is the general shape of the data? Are there any outliers in the data? (If so, what are the…
A: Given data is:
Q: From the options, choose the outliers, if any, for the following dataset: 8.5, 8.8, 11.4, 11.5,…
A: Scatterplot is of utmost importance in statistics . It is used to visualize the pattern as well as…
Q: Pls help ASAP
A:
Q: (d) Which countries are outliers? Select the outlier(s). Select "There are no outliers.", if…
A: Given data is2,1,7,2,2,19,18,6,4,9,4,20,1,2,1,3,2,33,4,2,23,10,15,100Arrange the data in ascending…
Q: A student wants to determine whether or not a value in her data is an outlier. She has calculated Q,…
A: The first quartile (Q1) is a value below which 25% of the observations lies and above which 75% of…
Q: this is one question. the table has already been answered. are there any potential outliers?
A: Yes. There is one potential outlier.
Q: a. A buyer can afford to pay up to $150 thousand. Assulmilng The proportion of homes that the buyer…
A: Hello. Since your question has multiple sub-parts, we will solve first three sub-parts for you. If…
Q: Suppose that the result of a public opinion poll shows that just 10% of people would be willing to…
A:
Q: Suppose that 50 measurements were taken and the mean was calculated to be 4.55. Assume next that one…
A:
Q: A frequency table of grades has five classes (A, B, C, D, F) with frequencies of respectively…
A: The relative frequency of the five classes is obtained below:The formula for the relative frequency…
Q: The registrar’s office at ACC predicts that 90% of the 6,950 spaces open in various math classes…
A:
Q: The five number summary of a dataset was found to be: 0, 3, 10, 15, 19 An observation is considered…
A: Five number summary contains minimum value, lower quartile, median, upper quartile and maximum value…
Q: A set includes the following five numbers: 20,19,50,18,16 which data measure decreases when the…
A: The set is the collection of real numbers, given as
Q: Identify all possible outliers from the following data set: 0.1 4 5.2 4.75 6.1 5 17.2 3.9 7.8
A: Given problem Given that We have to find all possible outliers from the following data set. 0.1,…
Q: Suppose you want to investigate the proportion of households in Muscat governorate that have fire…
A: Given information: The investigator is specially interested to estimate the proportion of households…
Q: 2.) Listed below are the number of Atlantic hurricanes occurring in each year. The data are listed…
A: d) Arrange the given data in ascending order: 2, 3, 4, 4, 5, 6, 6, 7, 7, 8, 8, 9, 9, 10, 12, 15 Draw…
Step by step
Solved in 2 steps