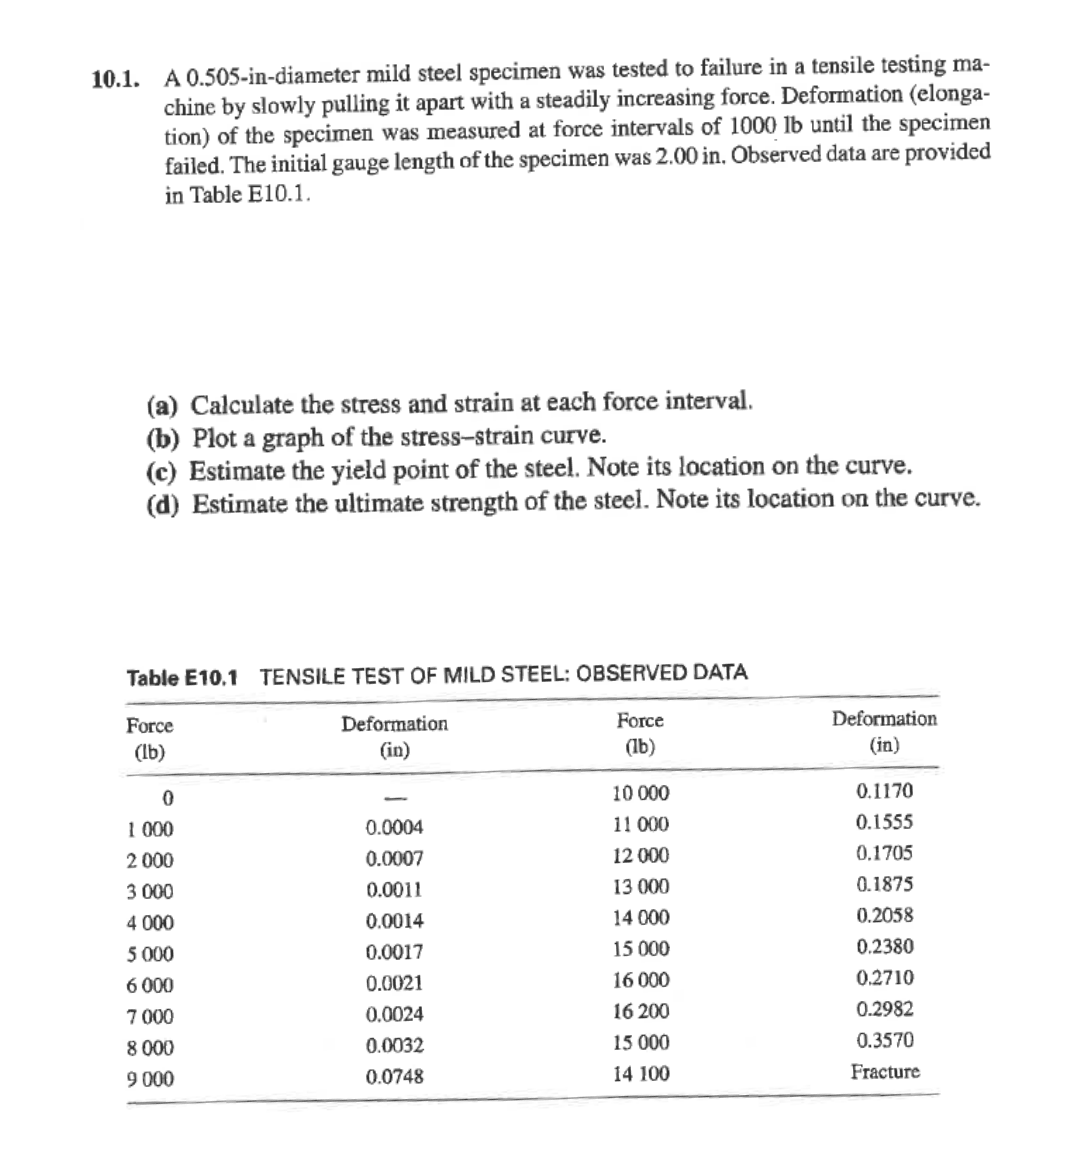
10.1. A 0.505-in-diameter mild steel specimen was tested to failure in a tensilé tëstihg fma- chine by slowly pulling it apart with a steadily increasing force. Deformation (elonga- tion) of the specimen was measured at force intervals of 1000 lb until the specimen failed. The initial gauge length of the specimen was 2.00 in. Observed data are provided in Table E10.1. (a) Calculate the stress and strain at each force interval. (b) Plot a graph of the stress-strain curve. (c) Estimate the yield point of the steel. Note its location on the curve. (d) Estimate the ultimate strength of the steel. Note its location on the curve.
10.1. A 0.505-in-diameter mild steel specimen was tested to failure in a tensilé tëstihg fma- chine by slowly pulling it apart with a steadily increasing force. Deformation (elonga- tion) of the specimen was measured at force intervals of 1000 lb until the specimen failed. The initial gauge length of the specimen was 2.00 in. Observed data are provided in Table E10.1. (a) Calculate the stress and strain at each force interval. (b) Plot a graph of the stress-strain curve. (c) Estimate the yield point of the steel. Note its location on the curve. (d) Estimate the ultimate strength of the steel. Note its location on the curve.

Steel Design (Activate Learning with these NEW titles from Engineering!)
6th Edition
ISBN:9781337094740
Author:Segui, William T.
Publisher:Segui, William T.
Chapter1: Introduction
Section: Chapter Questions
Problem 1.5.6P: The data in Table 1.5.3 were obtained from a tensile test of a metal specimen with a rectangular...

Related questions
Question
Calculate the stress and strain at each force interval. Plot a graph of the stress-strain curve. Estimate the yield point of the steel and note its location on the curve. Estimate the ultimate strength of the steel and note its location on the curve.
Transcribed Image Text:10.1. A 0.505-in-diameter mild steel specimen was tested to failure in a tensile testing ma-
chine by slowly pulling it apart with a steadily increasing force. Deformation (elonga-
tion) of the specimen was measured at force intervals of 1000 lb until the specimen
failed. The initial gauge length of the specimen was 2.00 in. Observed data are provided
in Table E10.1.
(a) Calculate the stress and strain at each force interval.
(b) Plot a graph of the stress-strain curve.
(c) Estimate the yield point of the steel. Note its location on the curve.
(d) Estimate the ultimate strength of the steel. Note its location on the curve.
Table E10.1 TENSILE TEST OF MILD STEEL: OBSERVED DATA
Force
Deformation
Force
Deformation
(Ib)
(in)
(lb)
(in)
10 000
0.1170
1 000
0.0004
11 000
0.1555
2 000
0.0007
12 000
0.1705
3 000
0.0011
13 000
0.1875
4 000
0.0014
14 000
0.2058
5 000
0.0017
15 000
0.2380
6 000
0.0021
16 000
0.2710
7 000
0.0024
16 200
0.2982
8 000
0.0032
15 000
0.3570
9 000
0.0748
14 100
Fracture
Expert Solution
This question has been solved!
Explore an expertly crafted, step-by-step solution for a thorough understanding of key concepts.

This is a popular solution!

Trending now
This is a popular solution!

Step by step
Solved in 3 steps with 2 images

Knowledge Booster


Learn more about
Need a deep-dive on the concept behind this application? Look no further. Learn more about this topic, civil-engineering and related others by exploring similar questions and additional content below.Recommended textbooks for you
Steel Design (Activate Learning with these NEW ti…
Civil Engineering
ISBN:
9781337094740
Author:
Segui, William T.
Publisher:
Cengage Learning

Materials Science And Engineering Properties
Civil Engineering
ISBN:
9781111988609
Author:
Charles Gilmore
Publisher:
Cengage Learning
Steel Design (Activate Learning with these NEW ti…
Civil Engineering
ISBN:
9781337094740
Author:
Segui, William T.
Publisher:
Cengage Learning
Materials Science And Engineering Properties
Civil Engineering
ISBN:
9781111988609
Author:
Charles Gilmore
Publisher:
Cengage Learning