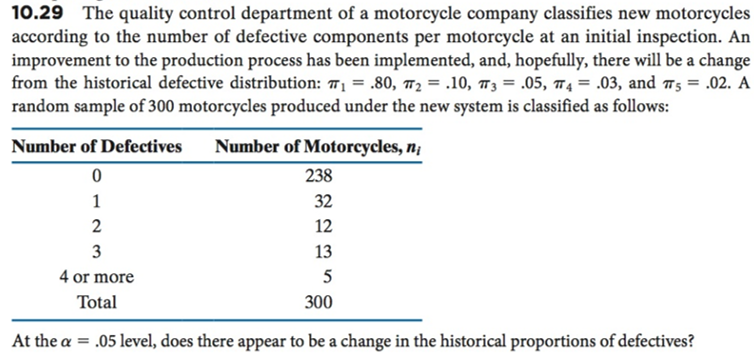
10.29 The quality control department of a motorcycle company classifies new motorcycles according to the number of defective components per motorcycle at an initial inspection. An improvement to the production process has been implemented, and, hopefully, there will be a change from the historical defective distribution: π1-.80, π,-.10, π,-05, π4-03, and π5-02. A random sample of 300 motorcycles produced under the new system is classified as follows: Number of Defectives Number of Motorcycles, n 0 238 32 12 13 2 4 or more Total 300 At the a .05 level, does there appear to be a change in the historical proportions of defectives?
Q: A control chart for the number of nonconforming cell phone cases is maintained on a plastic molding…
A: Given information: np = 16.0 n = 100 np=16p=16n=16100=0.16…
Q: A random sample of 16 housewives indicates that 11 prefer brand A and 5 prefer brand B. Does the…
A: Let pA is defined as the population proportion of brand A, and pB is defined as the population…
Q: Miller (2008) examined the energy drink consumption of college undergraduates and found that female…
A: z-test is a statistical test which can be used for testing the means of the population. This can be…
Q: Which of the following is true about an observational prospective cohort study being designed to…
A: Given information: It is given that an observational prospective cohort study is being designed to…
Q: A manufacturing company designed a factorial experiment to determine whether the number of defective…
A: Given: Manual Automatic Machine 1 30 29 34 26 Machine 2 19 24 22 27
Q: An article reports on an experiment in which each of five groups consisting of six rats was put on a…
A: Given: Number of observations in each level r= 6 rats Number of levels k=5 Treatment: Types of…
Q: Assume that the crime rate distribution is approximately normal in both regions. (a)Use a calculator…
A: Given : For region in new England given data :…
Q: A study of fox rabies in southern Germany gave the following information about different regions and…
A: Obtain the 95% confidence interval estimate for the difference between the two population means. The…
Q: The calculations for a factorial experiment involving four levels of factor A, three levels of…
A: Given SST=280 SSA=26 SSB=23 SSAB=175 α=0.05 a=Number of levels of factor A=4 b=Number of levels of…
Q: A report stated that on average a child eats more than 35 candies on the Halloween day. We randomly…
A: Given data is appropriate for testing of hypothesis to test t-test for single mean. Because it is a…
Q: A study of fox rabies in southern Germany gave the following information about different regions and…
A: X1 X2 2 1 7 3 7 4 7 3 7 3 8 8 8 5 1 4 3…
Q: A group of researchers wanted to determine if there was a difference in the predation habits of…
A: Given information: The data represents the values of the watering hole #1 and watering hole #2.
Q: 7.15 A soft-drink firm is evaluating an investment in a new type of canning machine. The company has…
A: Given information:It is given that; a random sample of 40 cans is selected from the output of old…
Q: In an experiment to determine which of the three different missile systems is preferable, the…
A:
Q: A study of fox rabies in southern Germany gave the following information about different regions and…
A: The mean and standard deviation of both the data can be obtained as:
Q: 6.4.10 In a study of factors thought to be responsible for the adverse effects of smoking on human…
A: Given Information:
Q: The US National Survey on Drug Use and Health reports that 4.8% of persons 12 and older regu- larly…
A: p=0.048n=900x=54p⏞=xn=0.06 d) The test statistics is…
Q: A random sample of n1 = 10 regions in New England gave the following violent crime rates (per…
A: Given : Claim : the violent crime rate in the Rocky Mountain region is higher than in New England.
Q: A study of fox rabies in southern Germany gave the following information about different regions and…
A: Given Region - 1sample size = n1 = 16Data 1 7 7 6 5 8 8 1 3 3 3 2 5 1 4 6 Mean and standard…
Q: abstract
A: Categorical Independent Variables: The variables which are categorical and independent which means…
Q: The thicknesses of n = 41 glass sheets made using process A are measured and the statistics x = 3.04…
A: The random variable thickness follows normal distribution. There are two independent samples which…
Q: A quality control manager has concerns about the occurrence of defects on a component assembly used…
A:
Q: Miller (2008) examined the energy drink consumption of college undergraduates and found that males…
A: As per our guidelines, we are allowed to answer first three sub-parts of the question. Here Part a…
Q: An online clothing retailer is testing a new e-mail campaign by sending one version of the e-mail…
A: Note: Since you have posted questions with multiple subparts we will solve the first three questions…
Q: A random sample of n1 = 10 regions in New England gave the following violent crime rates (per…
A: The data shows the violent crime rates in two regions (New England, Rocky Mountain states).
Q: The US National Survey on Drug Use and Health reports that 4.8% of persons 12 and older regu- larly…
A: Note: " Since you have asked multiple sub-parts, we will solve the first three sub-parts for you. If…
Q: Miller (2008) examined the energy drink consumption of college undergraduates and found that males…
A: Given Male n=36 M=2.45 Female n=25 M=1.28 μ=1.85 σ=1.2
Q: Consider that a random sample of size 12 was selected from a normal population distribution. 105.6…
A: From the provided information, Sample size (n) = 12 The mean and standard deviation of the sample…
Q: A Michigan study concerning preference for outdoor activities used a questionnaire with a six-point…
A: a) The level of significance is 0.05.
Q: A study of fox rabies in southern Germany gave the following information about different regions and…
A: Since we only answer up to 3 sub-parts, we’ll answer the first 3. Please resubmit the question and…
Q: Miller (2008) examined the energy drink consumption of college undergraduates and found that males…
A: Given Male n=36 M=2.45 Female n=25 M=1.28 μ=1.85σ=1.2
Q: Weinstein, McDermott, and Roediger (2010) report that students who were given questions to be…
A: State the hypotheses.
Q: Did this sample of males consume significantly more energy drinks than the overall population…
A: As the population standard deviation is known, one should use a z test. Answer 1. Write the null and…
Q: In a study of factors thought to be responsible for the adverse effects of smoking on human…
A: Introduction: Denote μ1, μ2 as the true population mean cadmium levels (nanograms per gram) in…
Q: 2. Two suppliers manufacture a plastic gear used in a laser printer. The impact of these gears…
A:
Q: 5. Use the following results from the DIETFITS randomized control trial to answer the questions…
A: Explanation: a) As we can see in the given box plot.
Q: 6.4.10. In a study of factors thought to be responsible for the adverse effects of smoking on human…
A: Given information: A study to study the factors which are responsible for the adverse effects of…
Q: Suppose a researcher conducting a follow up study obtains a sample of n = 25 students classified as…
A: Solution: Given information: n= 36 Sample size of overweight students M= 4.48 Sample mean of…
Q: A study of fox rabies in a country gave the following information about different regions and the…
A: i. Here, sample sizes are small and population standard deviations are unknown. Therefore, t…
Q: 2. A study for adverse reactions assigned adults at random to one of two common pain relievers…
A: Given Information: Group 1: n1=733 x1=103 Group 2: n2=732 x2=85
Q: A study of fox rabies in southern Germany gave the following information about different regions and…
A: The mean for region I is, Thus, the mean for the region I is 4.625. Standard deviation: Thus, the…
Q: Do social robots walk or roll? Refer to the International Conference on Social Robotics (Vol. 6414,…
A: Hi! Thank you for the question As per the honor code, We’ll answer the first question since the…
Q: A 1980 study investigated the relationship between the use of OCs and the development of endometrial…
A: From the given information, Cancer No cancer Total OC Yes 6 8 14 OC No 111 387 498 Total…
Q: The article "Anodic Fenton Treatment of Treflan MTF" (D. Saltmiras and A. Lemley, Journal of…
A:
Q: What is the value of the sample test statistic?
A: The test statistic formula is, t=x¯1-x¯2sp21n1+1n2 In the formula sp2=n1-1s12+n2-1s22n1+n2-2,…
Q: Miller (2008) examined the energy drink consumption of college undergraduates and found that males…
A:
Q: 16. What if there was a smaller difference between the two groups? That is, if M, = 14 and M2 = 12.…
A: It is given that M1 = 14, M2 = 12 n1 = 14, n2 = 28 Pooled variance = 14
Q: A study was performed on 200 elementary school students to investigate whether regular Vitamin A…
A:
Trending now
This is a popular solution!
Step by step
Solved in 4 steps with 4 images
- According to a certain government agency for a large country, the proportion of fatal traffic accidents in the country in which the driver had a positive blood alcohol concentration (BAC) is 0.36. Suppose a random sample of 110 traffic fatalities in a certain region results in 49 that involved a positive BAC. Does the sample evidence suggest that the region has a higher proportion of traffic fatalities involving a positive BAC than the country at the α=0.05 level of significance?7.4. 4 A research center claims that 25% of adults in a certain country would travel into space on a commercial flight if they could afford it. In a random sample of 1200 adults in that country, 28% say that they would travel into space on a commercial flight if they could afford it. At α=0.01, is there enough evidence to reject the research center's claim? (b) Use technology to find the P-value. Identify the standardized test statistic. z=10. The research department at the home office of Superior Insurance conducts ongoing research on the causes of automobile accidents, the characteristics of the drivers, and so on. A random sample of 400 policies written on single persons revealed 120 had at least one accident in the previous three- year period. Similarly, a sample of 600 policies written on married persons revealed that 150 had been in at least one accident. At the 0.05 significance level, is there a significant difference in the proportions of single and married persons having an accident during a three-year period? Determine and interpret the p- value.
- In analyzing the consumption of cottage cheese by members of various occupational groups, the United Dairy Industry Association found that 326 of 837 professionals seldom or never ate cottage cheese, versus 220 of 489 white-collar workers and 522 of 1243 blue-collar workers (Sheet 53). Assuming independent samples, use the 0.03 level in testing the null hypothesis that the population proportions could be the same for the three occupational groups. Sheet 53 Group 1 Group 2 Group 3 Total seldom or never 326 220 522 1068 often 511 269 721 1501 Total 837 489 1243 2569 Select one: a) chi-square stat = 4.81, crit. value = 7.01, fail to reject H0, population proportions are not different b) p-value = 0.09, reject H0, population proportions are not different c) chi-square stat = 4.81, crit. value = 9.2, fail to reject H0, population proportions are not different d) p-value = 0.029, reject H0, population proportions differentConsider the following actual data from a study by Lyon and Greenberg (1991). The first factor in their factorial ANOVA was family background; female participants were classified into two groups (Group 1: codependent, women with an alcoholic parent; Group 2: non-codependent, women with nonalcoholic parents). Members of these two groups were randomly assigned to one of two conditions; they were asked to donate time to help a man who was described to them as either Mr. Wrong (exploitative, selfish, and dishonest) or Mr. Right (nurturant, helpful). The researchers predicted that women from a non-codependent/nonalcoholic family background would be more helpful to a person described as nurturant and helpful, whereas women from a codependent/alcoholic family background would be more helpful to a person described as needy, exploitative, and selfish. The table of means below represents the amount of time donated in minutes in each of the four cells of this 2 × 2 factorial design. In each cell,…A study, which randomly surveyed 3,700 households and drew on this information from the IRS, found that 79% of households have conducted at least one IRA rollover from an employer-sponsored retirement plan. Suppose a recent random sample of 90 households in a certain county was taken and respondents were asked whether they had ever funded an IRA account with a rollover from an employer-sponsored retirement plan. Based on the sample data below, can you conclude at the 0.10 level of significance that the proportion of households in the county that have funded an IRA with a rollover is different from the proportion for all households reported in the study? 77 respondents said they had funded an account; 13 respondents said they had not
- A sample of men and women who had passed their driver's test either the first time or the second time were surveyed, with the following results: Results of the driving testGender First time Second timeMen 126 211Women 135 178a) Do these data suggest that there is a relationship between gender and the passing of their driver’s test from which the present sample was drawn? Let alpha=.052.Are babies born to mothers who use assistive reproduction technology (ART) more likely to be born prematurely than babies conceivednaturally? The data in the accompanying table are from a random sample of 19,614 births. Each birth was classified according to whether the mother used ART and whether the baby was premature. Use these data to decide if there is convincing evidence of an association between the use of ART and whether or not a baby ispremature. Use?=0.05.ConceivedUsing ARTConceivedNaturallyPremature1542,405Not Premature21218,843 Hypotheses: Method:Q:__________________S:__________________T:__________________N:__________________ Check: Calculate: Communicate Results:A travel agency is interested in finding out if different age groups frequent different Spring Break destinations, in order to better target the appropriate audiences. A random sample of college Spring Break vacationers produces the results given in the table below. Is there enough evidence at the 0.010.01 level of significance to show that there is a relationship between age (by college classification) and destination? Observed Sample of College Students Beach Mountains City Home Total Freshman 13 6 9 10 38 Sophomore 23 6 11 8 48 Junior 21 11 13 19 64 Senior 26 25 10 16 77 Total 83 48 43 53 227 Step 1 of 4: Calculate the expected value for the number of sophomores going to the mountains during Spring Break. Round your answer to six decimal places.Step 2 or 4: State the null hypothesis.Step 3 of 4: Compute the value of the test statistic. Round your answer to three decimal places, if necessary. (Note: If calculating by hand, be sure to use at least six…
- Miller (2008) examined the energy drink consumption of college undergraduates and found that female useenergy drinks significantly less often than males. To further investigate this phenomenon, suppose that a researcher selects a random sample of n = 36 male undergraduates and a sample of n = 25 females. On average, the males reported consuming M = 2.45 drinks per month and females had an average of M = 1.28. Assume that the overall level of consumption for college undergraduates averages mean = 1.85 energy drinks per month, and that the distribution of monthly consumption scores is approximately normal with a standard deviation is = 1.2. Use alpha =.01A travel agency is interested in finding out if different age groups frequent different Spring Break destinations, in order to better target the appropriate audiences. A random sample of college Spring Break vacationers produces the results given in the table below. Is there enough evidence at the 0.025 level of significance to show that there is a relationship between age (by college classification) and destination? Observed Sample of College Students Beach Mountains City Home Total Freshman 28 17 20 22 87 Sophomore 24 14 15 3 56 Junior 24 15 17 15 71 Senior 10 12 3 12 37 Total 86 58 55 52 251 Step 3 of 4: Compute the value of the test statistic. Round your answer to three decimal places, if necessary. (Note: If calculating by hand, be sure to use at least six decimal places in numbers for all intermediate calculations to ensure accuracy of the result.) Step 4 of 4: Draw a conclusion and interpret the decisionA random sample of Engineering and Architecture students of a university were interviewed to determine if there is an association between study habits and academic performance. The results were tabulated below. Students Favourable Neutral Unfavourable Engineering 80 60 70 Architecture 100 50 70 Test the hypothesis that there is no significant difference between the study habits and academic performance using a 0.05 level of significance.