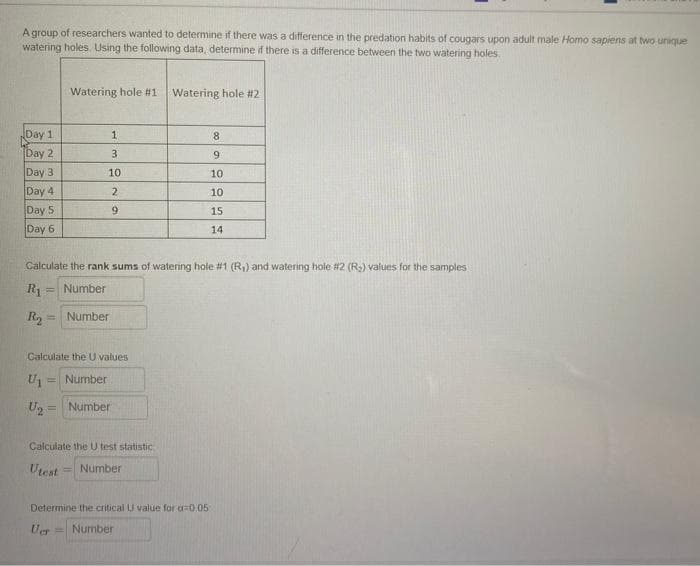
A group of researchers wanted to determine if there was a difference in the predation habits of cougars upon adult male Homo sapiens at two unique watering holes. Using the following data, determine if there is a difference between the two watering holes.
Q: Investigate the association between eye colour of husbands and eye colour of wives from the data…
A:
Q: Mr. Acosta, a sociologist, is doing a study to see if there is a relationship between the age of a…
A: The null and alternative hypotheses for the test are: H0: The age and type of movies preferred are…
Q: A psychologist at a private mental health facility was asked to determine whether there was a clear…
A: The objective is to test whether there is a clear difference in the length of stay for patients with…
Q: You are told that a study is a 3 x 3 ANOVA. Make up variables and conditions for such a study, and…
A: In Following example shows Make up variables and conditions for such a study, and create a diagram…
Q: Which of the following most closely approximates the line of best fit for the data in the…
A: NOTE: Refresh your page if you can't see any equations. . the given scatterplot is
Q: In a study, 10 healthy men were exposed to diesel exhaust for 1 hour. A measure of brain activity…
A: Given: Location 1 Before Location 1 After 6.4 8 8.6 12.7 7.4 8.4 8.6 9 9.8 8.4 8.9 11…
Q: An organization that tracks crime statistics reports that cars of make A model U, make A model V,…
A: The correlation is used to find the association between two quantitative variables.
Q: For which data set is the sample correlation coefficient r closest to 0? (Choose one) (b) For which…
A: Followings are the Explanation of the Question Correlation :- Correlation is a defined as a…
Q: A group of businessmen are interested in determining if there is a relationship between sales and…
A: Hypothesis testing
Q: A psychologist at a private mental health facility was asked to determine whether there was a clear…
A: Given Information: Consider the given data: Affective Disorders Cognitive Disorders Drug-related…
Q: The following data are obtained from a study that seeks to investigate the effects of an…
A: Hello! As you have posted more than 3 sub parts, we are answering the first 3 sub-parts. In case…
Q: Consider the following data:
A: Given information: Given data represents the values of the variables x and y.
Q: A study was conducted to determine the differences in the average weight loss of four groups of…
A: Given data is: Keto Diet Gym No exercise Intermittent 9 11 11.5 13.25 9.5 10 12 11.5 8.25…
Q: Mr. Acosta, a sociologist, is doing a study to see if there is a relationship between the age of a…
A:
Q: The table below summarizes data from a survey of a sample of women. Using a 0.01 significance…
A: The objective is to test the claim that the proportions of agree/disagree responses are the same…
Q: The director of student services at Oxnard College is interested in whether women are more likely to…
A: Let, p1^ be the proportion of freshmen women at Oxnard College who attend orientation. p2^ be the…
Q: a) Find the value of the chi-square statistic for the sample. (Round the expected frequencies to at…
A:
Q: The National Football League (NFL) records a variety of performance data for individuals and teams.…
A: Hi! Thank you for the question, As per the honor code, we are allowed to answer three sub-parts at a…
Q: A suburban hotel derives Its revenue from Its hotel and restaurant operations. The owners are…
A: For the given data Fill all the required blanks
Q: Suppose a study of driving under influence and driving without seatbelt produced the following data:…
A: Given data is Driving under influence in year 2021 Driving not under influence in year 2021…
Q: ay for patients with different categories of diagnosis. Looking at the last seven patients in each…
A: One-way ANOVA technique: Affective Disorders Cognitive Disorders Drug-related Conditions 7…
Q: In a study of all 2965 professors at a college, it is found that 45% own a computer. Determine…
A: It is given that 45% of professors have own computers out of 2,965 professors.
Q: QUESTION 11 Are beer (B), wine (W), and liquor (L) equally favored by Americans as the alcoholic…
A: Obtain the value of the test statistic. The value of the test statistic is obtained below as…
Q: paper in the Journal of Nervous and Mental Disorders reported the following data on the amount of…
A: Given : Claim : The true average percentages of recovery for the two conditions are equal.
Q: hree samples of each of three types of PVC pipe of equal wall thickness are tested to failure under…
A: Hello! As you have posted more than 3 sub parts, we are answering the first 3 sub-parts. In case…
Q: As an admissions counselor, I am interested in understanding whether or not there is a difference in…
A: State the hypotheses Let Factor A denotes the classes(Freshman V seniors) Let Factor B denotes the…
Q: As mentioned in Chapters 2 and 3 (pp. 38 and 81) Steven Schmidt (1994) reported a series of studies…
A: Given information n = 16 SS = 135 MD = 3.25 Null Hypothesis: - Humour has no significant effect on…
Q: The following data are from a hypothetical experiment in which one group of students took a quiz in…
A: In this study, one group of students took quiz in well-lit room and another group of students took…
Q: Mr. Acosta, a sociologist, is doing a study to see if there is a relationship between the age of a…
A: Formula : Test statistic
Q: A psychologist at a private mental health facility was asked to determine whether there was a clear…
A: Note: As per guidelines we will solve the first question only, please repost other questions for…
Q: As an admissions counselor, I am interested in understanding whether or not there is a difference in…
A: The objective is to check whether or not there is a difference between three majors (Psychology,…
Q: In a certain research, some astrologists have speculated that people born under certain sun signs…
A: Given information: The data represents the descriptive statistics of Neuroticism and Extroversion…
Q: An experiment was conducted in order to determine if cerebral blood flow in human beings can be…
A:
Q: Three samples of each of three types of PVC pipe of equal wall thickness are tested to failure under…
A: Since, you have posted a question with multiple sub-parts, we will solve only the first 3 sub-parts…
Q: The survey results are displayed in the segmented bar chart. Does there appear to be an association…
A: Given information: A segmented bar chart for the two categorical variables “Education level” and…
Q: (a) What is the level of significance? State the null and alternate hypotheses. H0: Age and movie…
A: As per our guidelines,we are allowed to answer first three sub-parts only. Thanks Given Data :…
Q: Consider the following scatterplot showing the relationship between caffeine intake and job…
A: From the scatter plot it is clear that even for high number of coffee test scores is too low. When…
Q: A forensic psychologist who specializes in personality traits and their relationship to crime…
A: Given information: The data represents the scores on a measure of thrill seeking and the number of…
Q: Of the variables you have studied so far, which type yields nonnumerical data?
A: Qualitative variable: A variable that is used for the classification of individuals based on some…
Q: Siegel (1990) found that elderly people who owned dogs were less likely to pay visits to their…
A: State the test hypotheses. Null hypothesis: H0:µ1-µ2=0 Alternative hypothesis: H1:µ1-µ2≠0…
Q: A sample of 10 adult men gave the following data
A: height weight 62 120 62 140 63 130 65 150 66 142 67 130 68 135 68 175 70 149…
Q: Mr. Acosta, a sociologist, is doing a study to see if there is a relationship between the age of a…
A: Provided information is, 18-23 yr 24-29 yr 30-35 yr Row Drama 7 13 14 34…
Q: the number of visits to the doctor during the past year for each person. The data are as follows:…
A: state the test hypothesis:
Q: The following data were collected from 10 randomly selected patients undergoing physical therapy…
A: Solution-: Given data: 24,32,50,62,21,45,80,24,30,10 To find the first quartile and third quartile?
Q: From the tollowing data tind out whether there is any relationship between sex and preference for…
A:
Q: The superintendent of Hospital 2 performed the Goodness of Fit Test to test whether 25% of the…
A: The given p-value for the test is 0.25091.
Q: Mr. Acosta, a sociologist, is doing a study to see if there is a relationship between the age of a…
A: Given that, Mr. Acosta, a sociologist, is doing a study to see if there is a relationship between…
Step by step
Solved in 2 steps with 1 images
- The following output was obtained from a computer program that performed a two-factorANOVA on a factorial experiment. Two-way ANOVA: y versus A, BSource DF SS MS F PA 1 0.322 ? ? 0.8513B ? 80.554 40.2771 4.59 0.0331Interaction ? ? ? ? 0.1167Error 12 105.327 8.7773Total 17 231.551 (a) Fill in the blanks in the ANOVA table.A researcher wants to know if the time spent in prison for a particular type of crime was the same for men and women. A random sample of men and women were each asked to give the length of sentence received. The data, in years, are listed to the right. Use the Wilcoxon rank sum test to find R, the sum of the ranks for the smaller sample, to test the claim that there is no difference in the sentence received by each gender. Men 10 22 16 18 19 26 Women 9 12 9 14 26 12 Men 14 22 12 19 23 24 Women 34 8 10 13 17 27 A. 125.5 B. 115.5 C. 173.5 D. 155.5The table below contains the total cost ($) for four tickets to a basketball game purchased on the secondary market, two beers, two soft drinks, two hot dogs, and one parking space at each arena during a recent season. 298.97364.59427.79213.23307.54531.23297.49302.56521.19291.69366.83532.67230.38320.12507.88212.87452.34656.21245.26436.92709.57220.91485.82727.63365.07487.58788.14360.31467.92886.93 a. Organize these costs as an ordered array. b. Construct a frequency distribution and a percentage distribution for these costs. c. Around what values, if any, are at least 75% of the costs of attending the game concentrated? Explain.
- An alloy manufacturer is investigating if they can improve the strength of one of their alloysby producing it at a lower temperature. To investigate that, they produce the alloy at twodifferent temperatures (high and low) and then measure the breaking strength of randomsamples of specimens from each. The following table represents the strength of the randomsamples at the higher and lower temperature, in units of 0.001-inch deflection. Temp. Strength (0.001 inch)High 87 64 66 85 76 49 97 73 75 77 69 68 89 27 58 84Low 88 82 81 85 79 80 88 78 77 85 79 76 Do the results support the hypothesis that lowering the production temperature can improve thestrength of the alloy, with 95% confidence? (Hint: Don’t forget investigating variances. Use 98% confidence for that.)Benford's Law states that the first nonzero digits of numbers drawn at random from a large complex data file have the following probability distribution.† First Nonzero Digit 1 2 3 4 5 6 7 8 9 Probability 0.301 0.176 0.125 0.097 0.079 0.067 0.058 0.051 0.046 Suppose that n = 275 numerical entries were drawn at random from a large accounting file of a major corporation. The first nonzero digits were recorded for the sample. First Nonzero Digit 1 2 3 4 5 6 7 8 9 Sample Frequency 75 48 37 26 25 18 13 17 16 Use a 1% level of significance to test the claim that the distribution of first nonzero digits in this accounting file follows Benford's Law. (b) Find the value of the chi-square statistic for the sample. (Round the expected frequencies to at least three decimal places. Round the test statistic to three decimal places.) What are the degrees of freedom?Benford's Law states that the first nonzero digits of numbers drawn at random from a large complex data file have the following probability distribution.† First Nonzero Digit 1 2 3 4 5 6 7 8 9 Probability 0.301 0.176 0.125 0.097 0.079 0.067 0.058 0.051 0.046 Suppose that n = 275 numerical entries were drawn at random from a large accounting file of a major corporation. The first nonzero digits were recorded for the sample. First Nonzero Digit 1 2 3 4 5 6 7 8 9 Sample Frequency 88 46 30 25 22 18 13 17 16 State the null and alternate hypotheses. H0: The distributions are different.H1: The distributions are the same.H0: The distributions are the same.H1: The distributions are the same. H0: The distributions are the same.H1: The distributions are different.H0: The distributions are different.H1: The distributions are different. (b) Find the value of the chi-square statistic for the sample. (Round the expected frequencies to at least three decimal places. Round the…
- An insurance company offers its policyholders a number of differentpremium payment options. For a randomly selected policyholder, let X=the number of months between successive payments. The cdf of X is asfollows:(attached) a. What is the pmf of X?b. Using just the cdf, compute P(3≤ x ≤6) and P(4 ≤ X).Nationally, at least 60% of Ph.D. students have paid assistantships. A collegedean feels that this is not true in his state, so he randomly selects 50 Ph.D.students and finds that 26 have assistantships. At α = 0.05, is the deancorrect?Marine biologists have noticed that the color of the outermost growth band on a clam tends to be related to the time of year in which the clam dies. A biologist conducted a small investigation of whether this is true for the species Protothaca staminea. She collected a sample of 55 clam shells in February and 55 clam shells in March. 14 of the shells from February had a dark color on the outermost growth band, whereas 8 of the shells from March had a dark color on the outermost growth band. Carry out a hypothesis test to see if there is a difference in the proportion of shells with a dark outermost growth band between the two months; specifically, if the population proportion in February is higher than March. Let ? = 0.1.Note: Do all calculations as February - MarchA) The point estimate for the true difference in proportion of dark growth bands between February and March is: Note: answer using 4 decimal precisionB) The test statistic, ztest, is: Note: answer using 2 decimal…
- An insurance company offers its policyholders a number of different premium payment options. For a randomly selected policyholder, let X = the number of months between successive payments. The cdf of X is as follows: REFER IMAGE a. What is the pmf of X?b. Using just the cdf, compute P(3 ≤ x ≤ 6) and P(4 ≤ X)Is it possible to make a X-Bar and R control chart without a data set? I'm told to solve it by hand, but am unsure of how to do that with only the summation notationAccording to a recent marketing campaign, drinkers of either Diet Coke or Diet Pepsi participated in blind taste tests to see which of the drinks was their favorite. In one Pepsi television commercial, an anouncer states that "in recent blind taste tests, at least one half of the surveyed preferred Diet Pepsi over Diet Coke." Suppose that in one of those taste tests, 5050 out of the 120120 participating preferred Diet Pepsi. Test the hypothesis, using α=0.05α=0.05 that at least half of all participants will select Diet Pepsi in a blind taste (hint: take HaHa to be that fewer than half prefer Diet Pepsi) test by giving the following:(a) the test statistic Recall the zz value that marks the start of the rejection region is the critical zz score; if you're lower tailed, it's the zz value that has left area of αα; if you're right tailed, it's the zz value whose area to the right is αα; if you're two-tailed, they're the values of the ±z±z value that −z−z has left area of α2α2 and zz…