100 Topic 2: Graphical Descriptive Statistics 7.2 12. A survey of 200 seniors at a particular university asked, "What is most likely to be your principal activity upon graduation?" The results are summarized below. Activity Frequency 128 Full-time Employment Part-time Employment Full-time Graduate Work 10 42 Part-time Graduate Work Military Service Volunteer Activities 4 Other 8. (a) Construct a well labeled bar chart using relative frequency. (b) What is the mode? (c) If the categories were labeled according to decreasing frequency, what kind of bar chart would we have? 13. Data on condo prices was collected from the popular site, Zillow. Condos for sale with at least two bedrooms were searched for in three coastal cities in the southeast. Prices for fifteen condos in each city are displayed in hundreds of thousands of dollars in Figure 7.1. Figure 7.1: Condo prices in three coastal cities (a) Describe the shape of condo prices in each city. (b) Which city has the largest variability in condo pricing? The lowest variability? (c) The center of condo prices is highest for which city? Lowest for which city? 1.. 1.. 4 6. 8 Condo Price in $100,000's Miami Myrtle Beach Savannah 000000. 2. 14. A recent survey of universities and colleges in each state was conducted. The number of univer- sities and colleges was recorded for each of the fifty states. A histogram of the results is given in Figure 7.2 (a) States with the highest amount of colleges and universities fall within what range? Figure 7.2: Number of colleges and universities in each of the fifty states (b) It is most common for a state to have what number of universities? That is, give the range represented by the mode. (c) Approximately how many states have at least 400 uiversities? 25 (d) Approximately what proportion of states have at least 400 universities? 10 (e) Approximately what proportion of states have at most 200 universities? 1000 1200 1400 600 800 400 200 Number of Colleges and Universities 15. The site data.cms.gov provides data on average expenditures for medical procedures across the nation. The histogram in Figure 7.3 displays Medicare payments for patients with septicemia or severe sepsis in a random sample of thirty-six hospitals. Figure 7.3: Medicare payments for sepsis patients at 36 hospitals (a) Describe the key features of the histogram. (b) Approximately what percent of Medicare payments for sepsis are at most $10,000? (c) Approximately what percent of Medicare payments for sepsis are at least $13,000? 14000 18000 16000 12000 10000 8000 Medicare Payments (dollars) Frequency Frequency 2 5 15 20 35 4. 9.
100 Topic 2: Graphical Descriptive Statistics 7.2 12. A survey of 200 seniors at a particular university asked, "What is most likely to be your principal activity upon graduation?" The results are summarized below. Activity Frequency 128 Full-time Employment Part-time Employment Full-time Graduate Work 10 42 Part-time Graduate Work Military Service Volunteer Activities 4 Other 8. (a) Construct a well labeled bar chart using relative frequency. (b) What is the mode? (c) If the categories were labeled according to decreasing frequency, what kind of bar chart would we have? 13. Data on condo prices was collected from the popular site, Zillow. Condos for sale with at least two bedrooms were searched for in three coastal cities in the southeast. Prices for fifteen condos in each city are displayed in hundreds of thousands of dollars in Figure 7.1. Figure 7.1: Condo prices in three coastal cities (a) Describe the shape of condo prices in each city. (b) Which city has the largest variability in condo pricing? The lowest variability? (c) The center of condo prices is highest for which city? Lowest for which city? 1.. 1.. 4 6. 8 Condo Price in $100,000's Miami Myrtle Beach Savannah 000000. 2. 14. A recent survey of universities and colleges in each state was conducted. The number of univer- sities and colleges was recorded for each of the fifty states. A histogram of the results is given in Figure 7.2 (a) States with the highest amount of colleges and universities fall within what range? Figure 7.2: Number of colleges and universities in each of the fifty states (b) It is most common for a state to have what number of universities? That is, give the range represented by the mode. (c) Approximately how many states have at least 400 uiversities? 25 (d) Approximately what proportion of states have at least 400 universities? 10 (e) Approximately what proportion of states have at most 200 universities? 1000 1200 1400 600 800 400 200 Number of Colleges and Universities 15. The site data.cms.gov provides data on average expenditures for medical procedures across the nation. The histogram in Figure 7.3 displays Medicare payments for patients with septicemia or severe sepsis in a random sample of thirty-six hospitals. Figure 7.3: Medicare payments for sepsis patients at 36 hospitals (a) Describe the key features of the histogram. (b) Approximately what percent of Medicare payments for sepsis are at most $10,000? (c) Approximately what percent of Medicare payments for sepsis are at least $13,000? 14000 18000 16000 12000 10000 8000 Medicare Payments (dollars) Frequency Frequency 2 5 15 20 35 4. 9.

Glencoe Algebra 1, Student Edition, 9780079039897, 0079039898, 2018
18th Edition
ISBN:9780079039897
Author:Carter
Publisher:Carter
Chapter10: Statistics
Section10.4: Distributions Of Data
Problem 19PFA

Related questions
Topic Video
Question
Please help
Transcribed Image Text:100
Topic 2: Graphical Descriptive Statistics
7.2
12. A survey of 200 seniors at a particular university asked, "What is most likely to be your principal
activity upon graduation?" The results are summarized below.
Activity Frequency
128
Full-time Employment
Part-time Employment
Full-time Graduate Work
10
42
Part-time Graduate Work
Military Service
Volunteer Activities
4
Other
8.
(a) Construct a well labeled bar chart using relative frequency.
(b) What is the mode?
(c) If the categories were labeled according to decreasing frequency, what kind of bar chart
would we have?
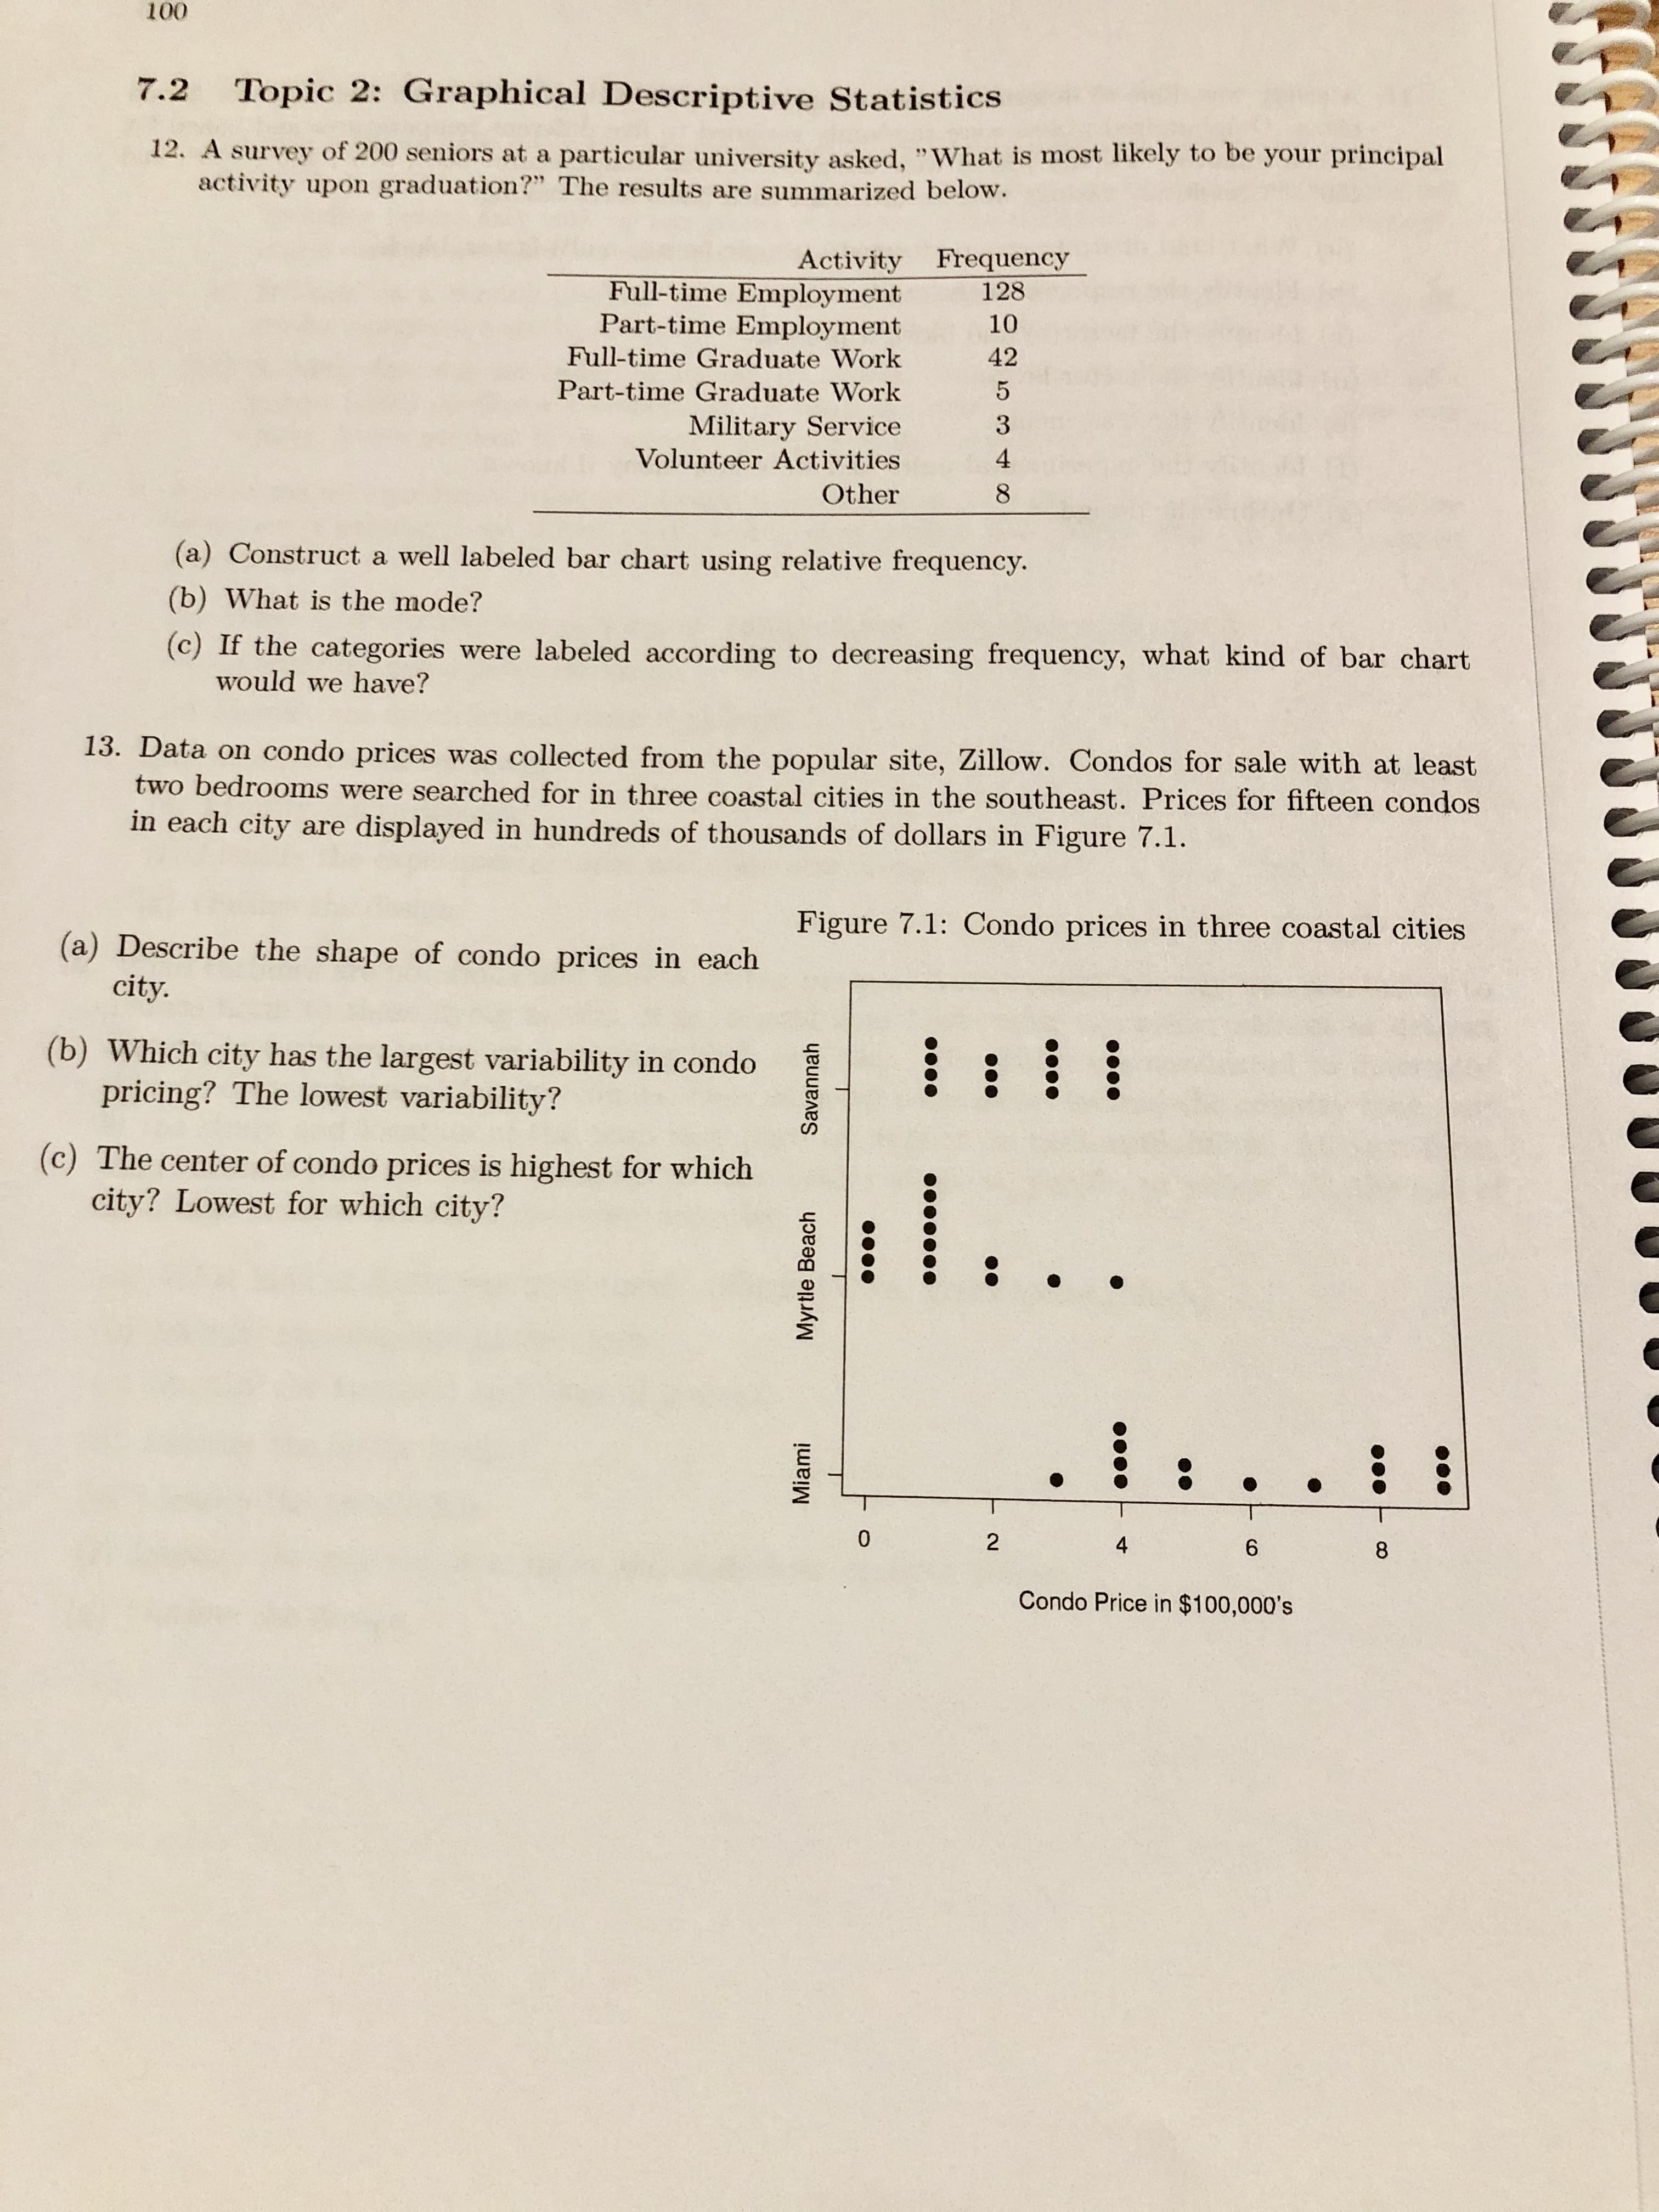
13. Data on condo prices was collected from the popular site, Zillow. Condos for sale with at least
two bedrooms were searched for in three coastal cities in the southeast. Prices for fifteen condos
in each city are displayed in hundreds of thousands of dollars in Figure 7.1.
Figure 7.1: Condo prices in three coastal cities
(a) Describe the shape of condo prices in each
city.
(b) Which city has the largest variability in condo
pricing? The lowest variability?
(c) The center of condo prices is highest for which
city? Lowest for which city?
1..
1..
4
6.
8
Condo Price in $100,000's
Miami
Myrtle Beach
Savannah
000000.
2.
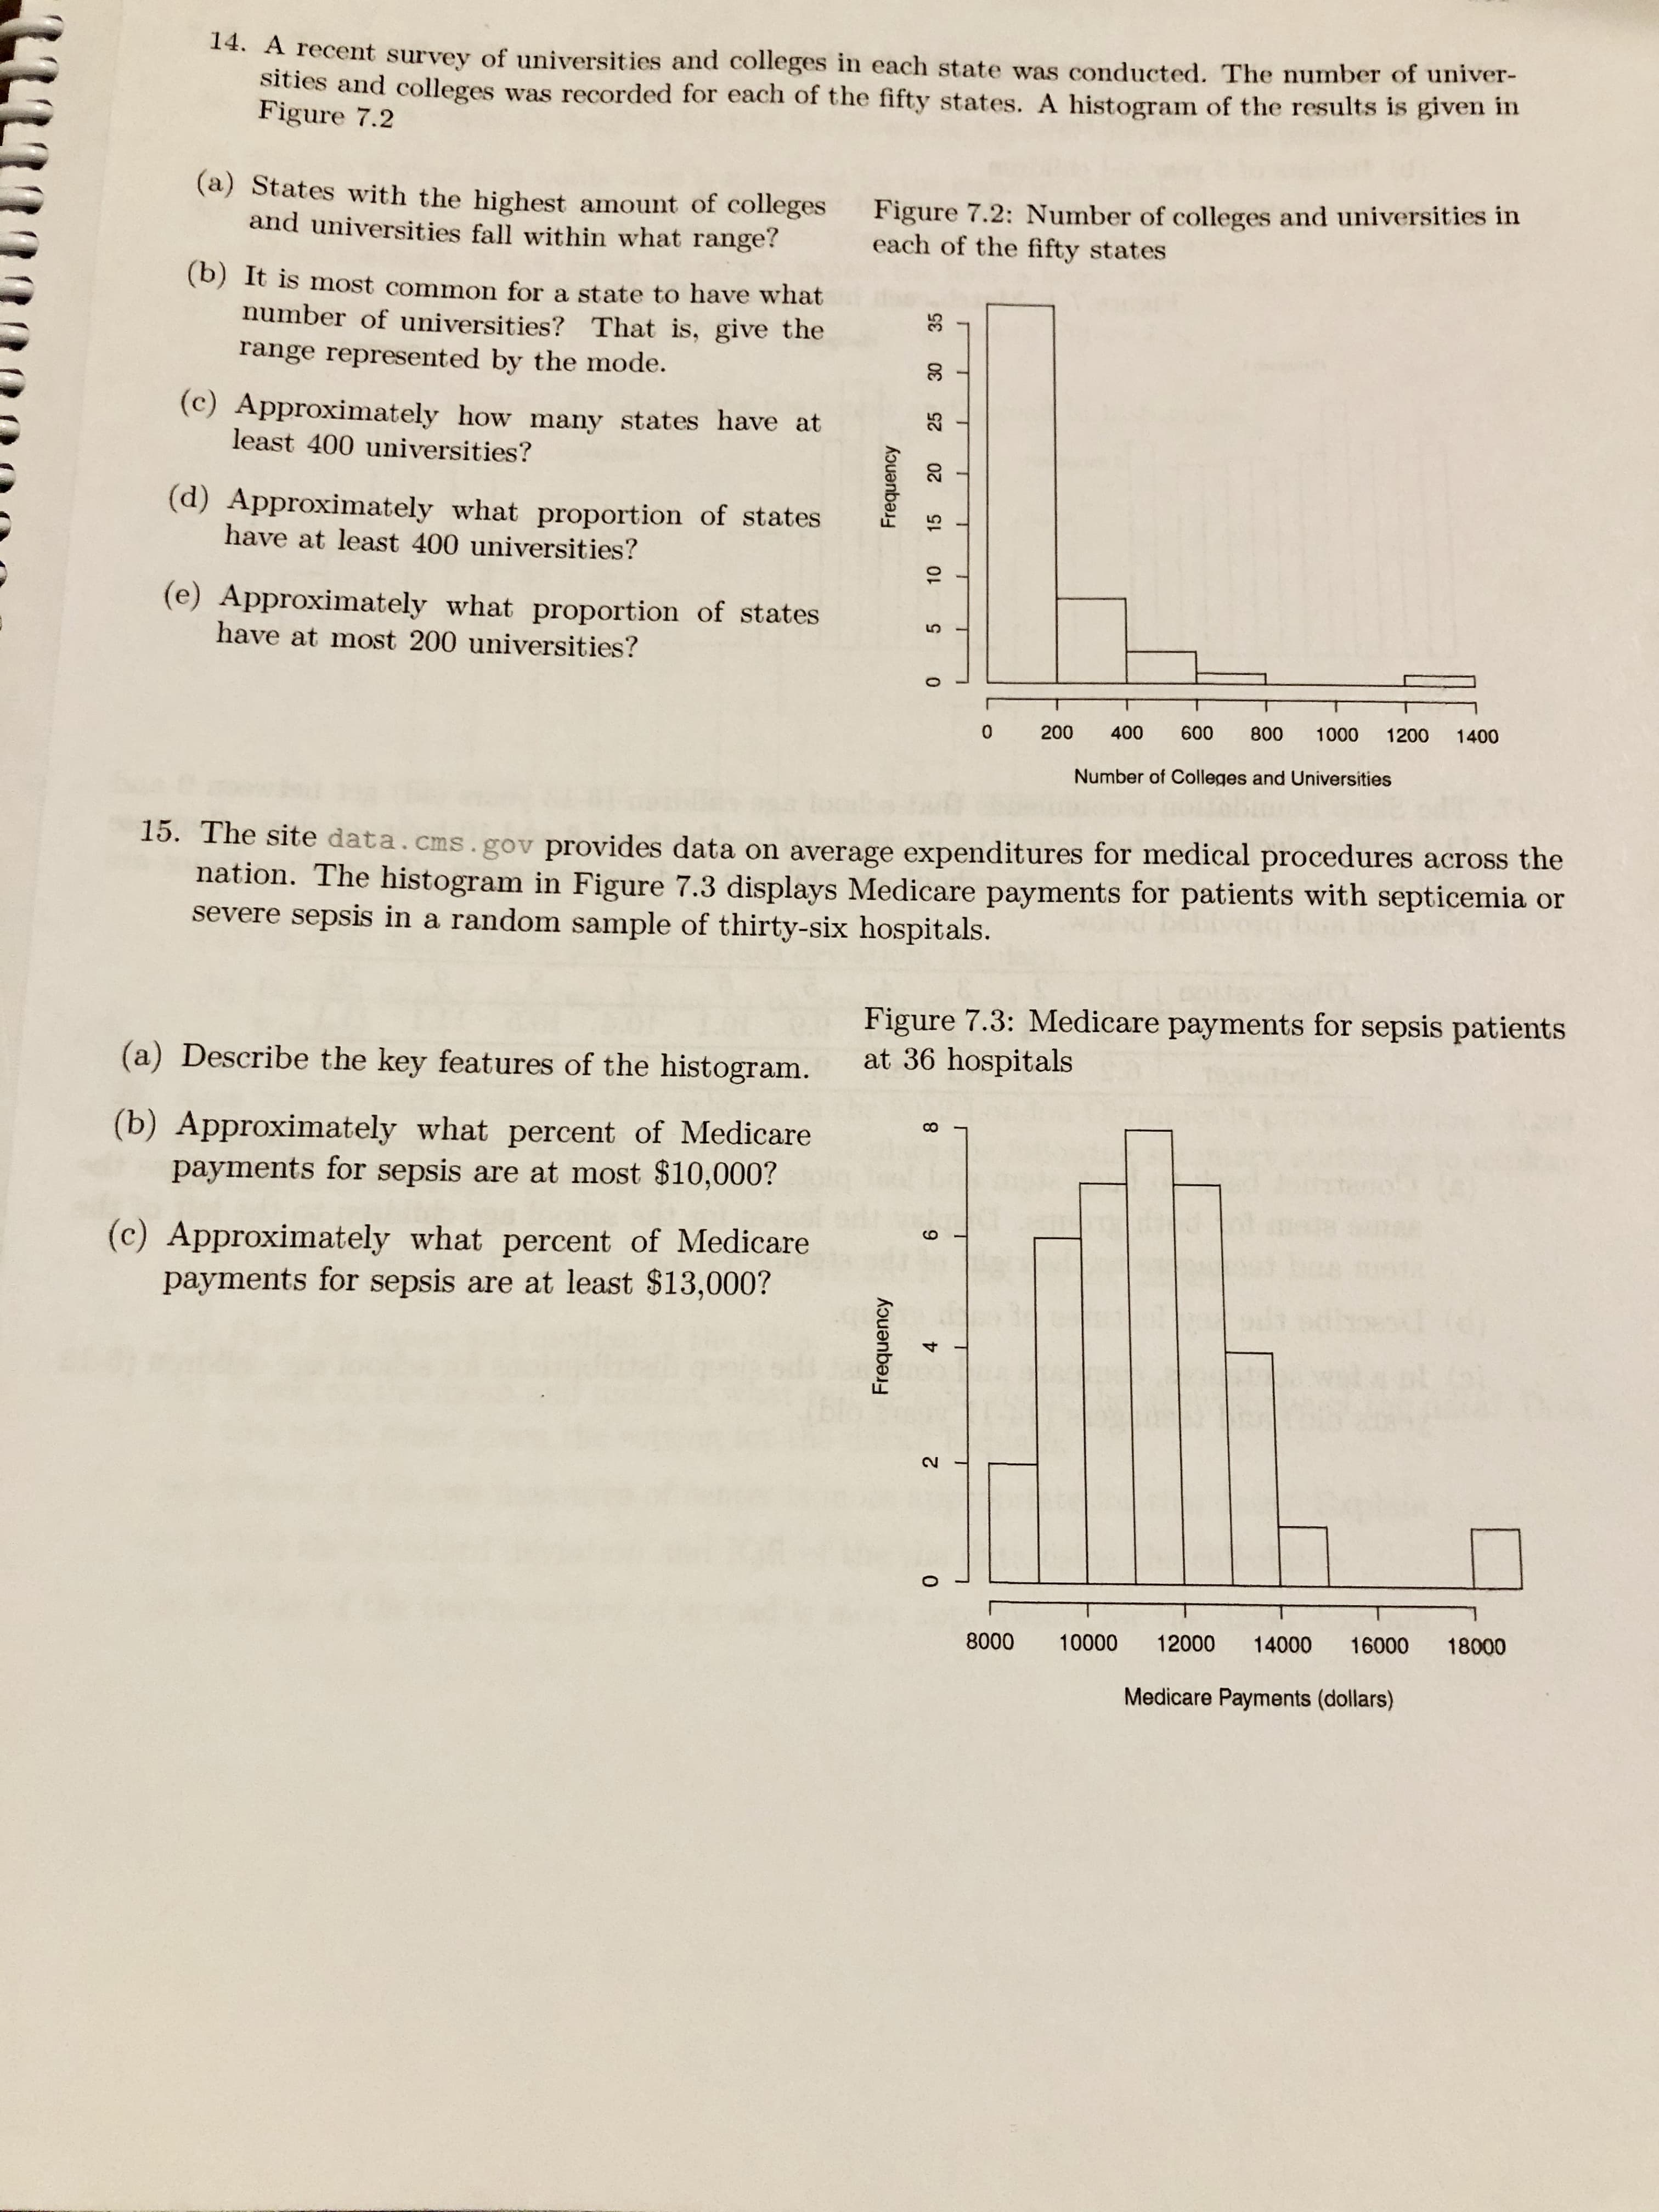
Transcribed Image Text:14. A recent survey of universities and colleges in each state was conducted. The number of univer-
sities and colleges was recorded for each of the fifty states. A histogram of the results is given in
Figure 7.2
(a) States with the highest amount of colleges
and universities fall within what range?
Figure 7.2: Number of colleges and universities in
each of the fifty states
(b) It is most common for a state to have what
number of universities? That is, give the
range represented by the mode.
(c) Approximately how many states have at
least 400 uiversities?
25
(d) Approximately what proportion of states
have at least 400 universities?
10
(e) Approximately what proportion of states
have at most 200 universities?
1000
1200
1400
600
800
400
200
Number of Colleges and Universities
15. The site data.cms.gov provides data on average expenditures for medical procedures across the
nation. The histogram in Figure 7.3 displays Medicare payments for patients with septicemia or
severe sepsis in a random sample of thirty-six hospitals.
Figure 7.3: Medicare payments for sepsis patients
at 36 hospitals
(a) Describe the key features of the histogram.
(b) Approximately what percent of Medicare
payments for sepsis are at most $10,000?
(c) Approximately what percent of Medicare
payments for sepsis are at least $13,000?
14000
18000
16000
12000
10000
8000
Medicare Payments (dollars)
Frequency
Frequency
2
5
15
20
35
4.
9.
Expert Solution
This question has been solved!
Explore an expertly crafted, step-by-step solution for a thorough understanding of key concepts.

This is a popular solution!

Trending now
This is a popular solution!

Step by step
Solved in 3 steps with 2 images

Knowledge Booster


Learn more about
Need a deep-dive on the concept behind this application? Look no further. Learn more about this topic, statistics and related others by exploring similar questions and additional content below.Recommended textbooks for you
Glencoe Algebra 1, Student Edition, 9780079039897…
Algebra
ISBN:
9780079039897
Author:
Carter
Publisher:
McGraw Hill
Glencoe Algebra 1, Student Edition, 9780079039897…
Algebra
ISBN:
9780079039897
Author:
Carter
Publisher:
McGraw Hill