10:07 AM Sun Apr 12 * * 70% AA A learn.umgc.edu Grammarly information is... Compound int... Statistics Q&... ALEKS -- Ass... Applying for t... PS3 p3 Sp... My No. 1 Stoc... finding midra... course hero lo... PS3 p3 Sp20 11) 11) Forty new automobiles were tested for fuel efficiency by the Environmental Protection Agency (in miles per gallon). The individual values and a frequency distribution are displayed below. 25 20 21 32 15 31 24 33 23 22 29 25 36 25 30 27 24 12 34 36 26 30 15 20 24 19 29 24 27 29 19 24 30 20 37 25 15 27 30 18 Class Frequency 8-12 13-17 3 18-22 8. 23-27 14 28-32 9. 33-37 5 Find the median, mode, and midrange of the data set.
10:07 AM Sun Apr 12 * * 70% AA A learn.umgc.edu Grammarly information is... Compound int... Statistics Q&... ALEKS -- Ass... Applying for t... PS3 p3 Sp... My No. 1 Stoc... finding midra... course hero lo... PS3 p3 Sp20 11) 11) Forty new automobiles were tested for fuel efficiency by the Environmental Protection Agency (in miles per gallon). The individual values and a frequency distribution are displayed below. 25 20 21 32 15 31 24 33 23 22 29 25 36 25 30 27 24 12 34 36 26 30 15 20 24 19 29 24 27 29 19 24 30 20 37 25 15 27 30 18 Class Frequency 8-12 13-17 3 18-22 8. 23-27 14 28-32 9. 33-37 5 Find the median, mode, and midrange of the data set.

Algebra and Trigonometry (6th Edition)
6th Edition
ISBN:9780134463216
Author:Robert F. Blitzer
Publisher:Robert F. Blitzer
ChapterP: Prerequisites: Fundamental Concepts Of Algebra
Section: Chapter Questions
Problem 1MCCP: In Exercises 1-25, simplify the given expression or perform the indicated operation (and simplify,...

Related questions
Question
100%
Transcribed Image Text:10:07 AM Sun Apr 12
* * 70%
AA
A learn.umgc.edu
Grammarly
information is...
Compound int...
Statistics Q&...
ALEKS -- Ass...
Applying for t...
PS3 p3 Sp...
My No. 1 Stoc...
finding midra...
course hero lo...
PS3 p3 Sp20
11)
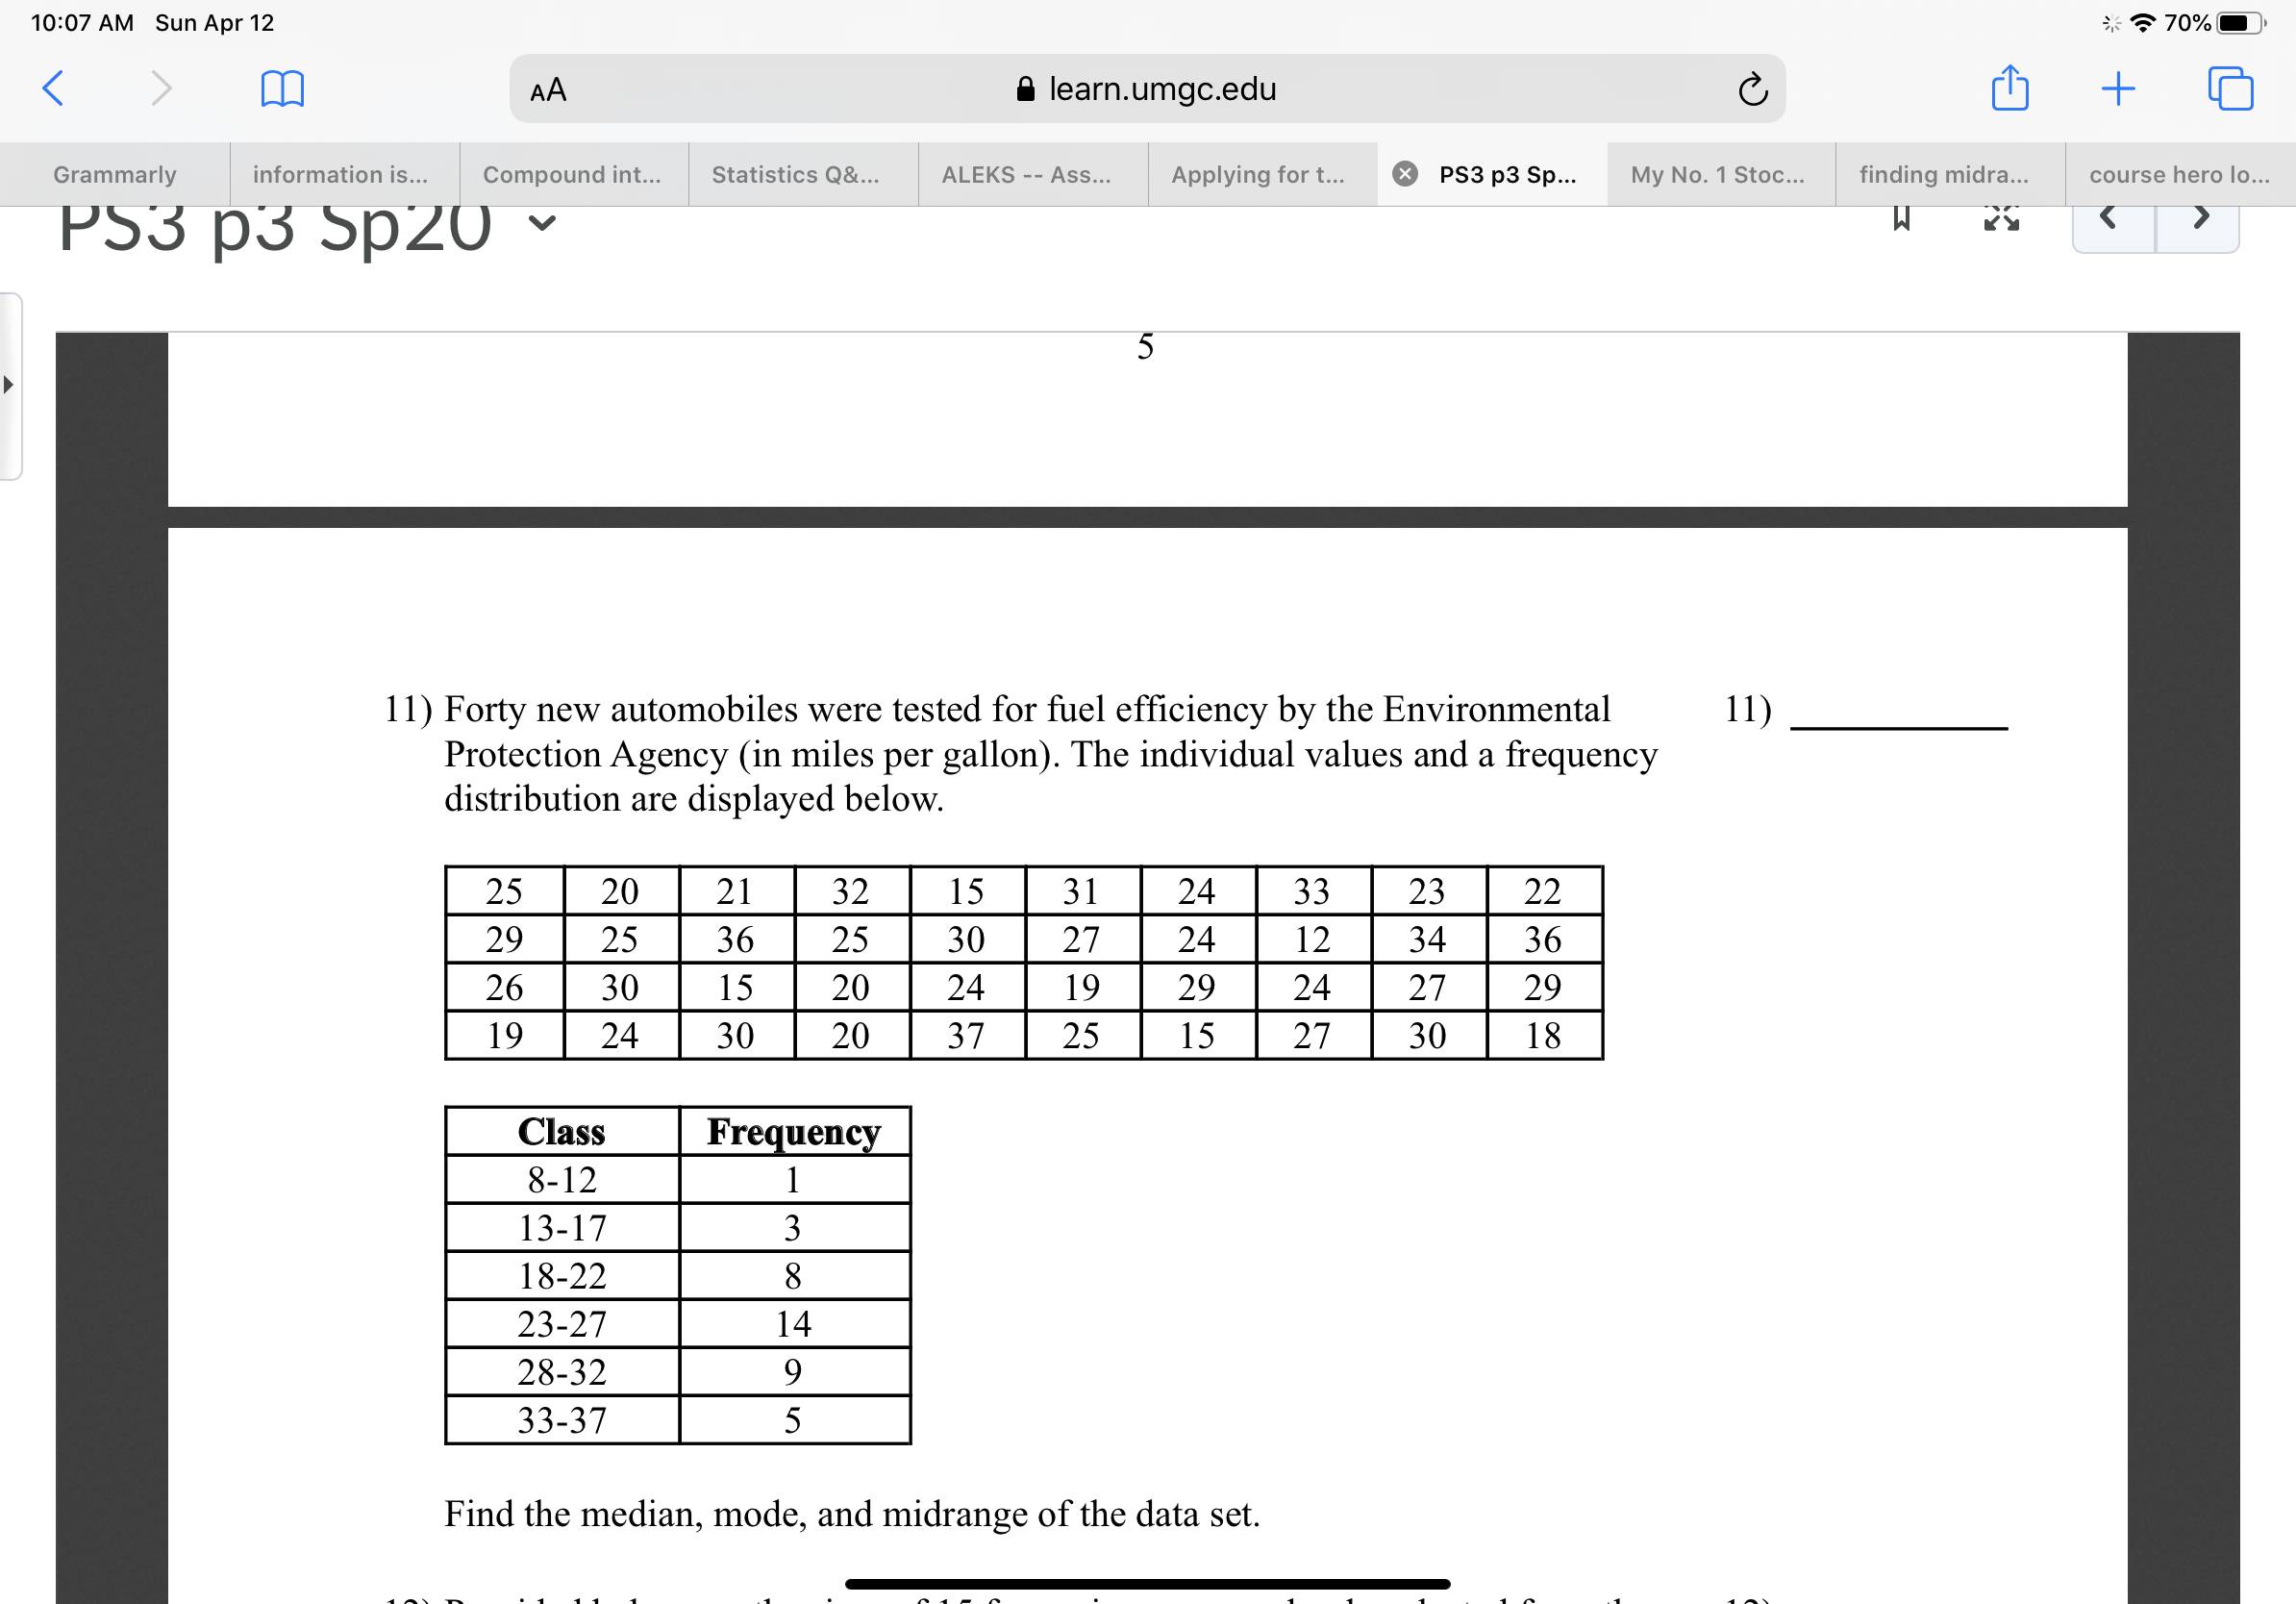
11) Forty new automobiles were tested for fuel efficiency by the Environmental
Protection Agency (in miles per gallon). The individual values and a frequency
distribution are displayed below.
25
20
21
32
15
31
24
33
23
22
29
25
36
25
30
27
24
12
34
36
26
30
15
20
24
19
29
24
27
29
19
24
30
20
37
25
15
27
30
18
Class
Frequency
8-12
13-17
3
18-22
8.
23-27
14
28-32
9.
33-37
5
Find the median, mode, and midrange of the data set.
Expert Solution
This question has been solved!
Explore an expertly crafted, step-by-step solution for a thorough understanding of key concepts.

This is a popular solution!

Trending now
This is a popular solution!

Step by step
Solved in 5 steps

Recommended textbooks for you
Algebra and Trigonometry (6th Edition)
Algebra
ISBN:
9780134463216
Author:
Robert F. Blitzer
Publisher:
PEARSON

Contemporary Abstract Algebra
Algebra
ISBN:
9781305657960
Author:
Joseph Gallian
Publisher:
Cengage Learning

Linear Algebra: A Modern Introduction
Algebra
ISBN:
9781285463247
Author:
David Poole
Publisher:
Cengage Learning
Algebra and Trigonometry (6th Edition)
Algebra
ISBN:
9780134463216
Author:
Robert F. Blitzer
Publisher:
PEARSON
Contemporary Abstract Algebra
Algebra
ISBN:
9781305657960
Author:
Joseph Gallian
Publisher:
Cengage Learning
Linear Algebra: A Modern Introduction
Algebra
ISBN:
9781285463247
Author:
David Poole
Publisher:
Cengage Learning

Algebra And Trigonometry (11th Edition)
Algebra
ISBN:
9780135163078
Author:
Michael Sullivan
Publisher:
PEARSON

Introduction to Linear Algebra, Fifth Edition
Algebra
ISBN:
9780980232776
Author:
Gilbert Strang
Publisher:
Wellesley-Cambridge Press

College Algebra (Collegiate Math)
Algebra
ISBN:
9780077836344
Author:
Julie Miller, Donna Gerken
Publisher:
McGraw-Hill Education