The following data shows the measured distance between A and B. Determine the Most probable distance between A and B.
The following data shows the measured distance between A and B. Determine the Most probable distance between A and B.

Algebra & Trigonometry with Analytic Geometry
13th Edition
ISBN:9781133382119
Author:Swokowski
Publisher:Swokowski
Chapter1: Fundamental Concepts Of Algebra
Section1.4: Fractional Expressions
Problem 66E

Related questions
Question
The following data shows the measured distance between A and B. Determine the Most probable distance between A and B.
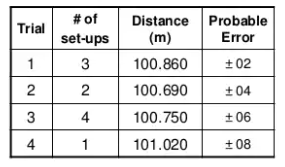
Transcribed Image Text:# of
Distance Probable
Trial
set-ups
(m)
Error
1
3
100.860
+ 02
2
2
100.690
+04
3
4
100.750
+ 06
4
1
101.020
1 08
Expert Solution
This question has been solved!
Explore an expertly crafted, step-by-step solution for a thorough understanding of key concepts.

Step by step
Solved in 3 steps

Recommended textbooks for you
Algebra & Trigonometry with Analytic Geometry
Algebra
ISBN:
9781133382119
Author:
Swokowski
Publisher:
Cengage
Algebra & Trigonometry with Analytic Geometry
Algebra
ISBN:
9781133382119
Author:
Swokowski
Publisher:
Cengage