A distance AB is observed repeatedly using the same equipment and procedures, and the results, in meters are listed. 3.9) 65.401 65.402 65.406 65.396 65.405 65.405 65.408 65.400 65.396 65.401 65.401 65.404 Calculate lel the ling'e most Rrebable length
A distance AB is observed repeatedly using the same equipment and procedures, and the results, in meters are listed. 3.9) 65.401 65.402 65.406 65.396 65.405 65.405 65.408 65.400 65.396 65.401 65.401 65.404 Calculate lel the ling'e most Rrebable length

Glencoe Algebra 1, Student Edition, 9780079039897, 0079039898, 2018
18th Edition
ISBN:9780079039897
Author:Carter
Publisher:Carter
Chapter10: Statistics
Section10.3: Measures Of Spread
Problem 26PFA

Related questions
Question
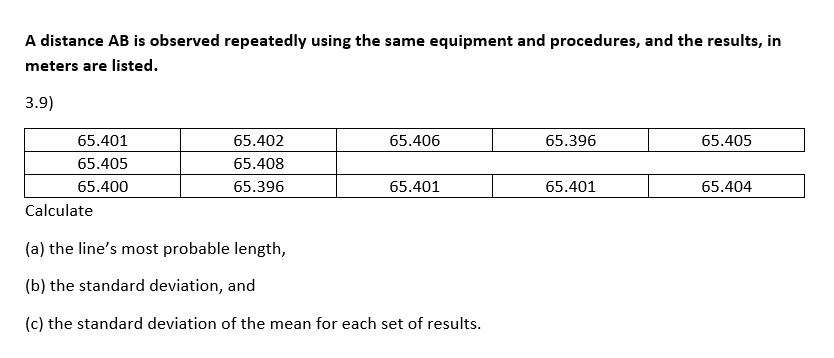
Transcribed Image Text:A distance AB is observed repeatedly using the same equipment and procedures, and the results, in
meters are listed.
3.9)
65.401
65.402
65.406
65.396
65.405
65.405
65.408
65.400
65.396
65.401
65.401
65.404
Calculate
(a) the line's most probable length,
(b) the standard deviation, and
(c) the standard deviation of the mean for each set of results.
Expert Solution
This question has been solved!
Explore an expertly crafted, step-by-step solution for a thorough understanding of key concepts.

This is a popular solution!

Trending now
This is a popular solution!

Step by step
Solved in 2 steps with 1 images

Recommended textbooks for you
Glencoe Algebra 1, Student Edition, 9780079039897…
Algebra
ISBN:
9780079039897
Author:
Carter
Publisher:
McGraw Hill
Glencoe Algebra 1, Student Edition, 9780079039897…
Algebra
ISBN:
9780079039897
Author:
Carter
Publisher:
McGraw Hill