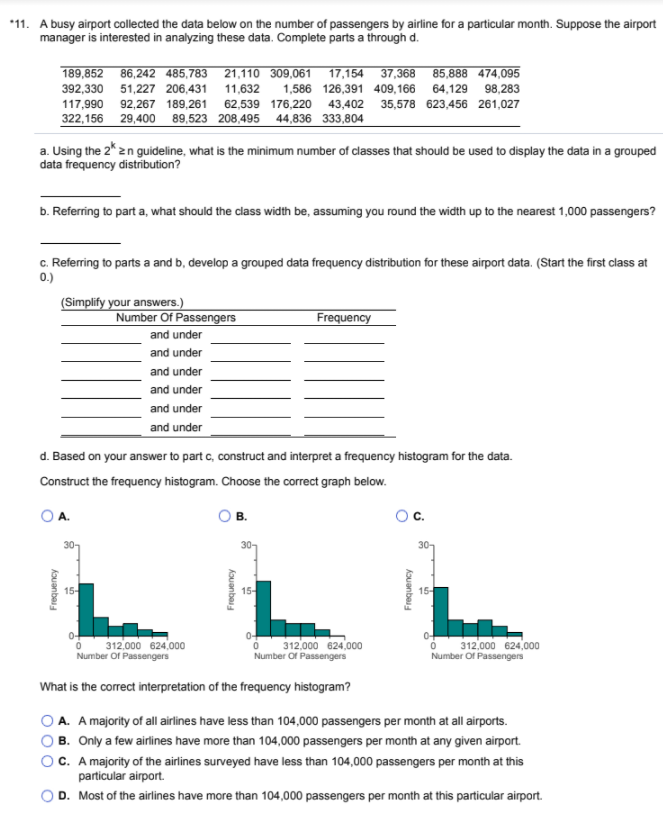
*11. A busy airport collected the data below on the number of passengers by airline for a particular month. Suppose the airport manager is interested in analyzing these data. Complete parts a through d. 189,852 86,242 485,783 21,110 309,061 17,154 37,368 392,330 51,227 206,431 85,888 474,095 64,129 98,283 11,632 1,586 126,391 409,166 117,990 92,267 189,261 62,539 176,220 43,402 35,578 623,456 261,027 322,156 29,400 89,523 208,495 44,836 333,804 a. Using the 2* zn guideline, what is the minimum number of dlasses that should be used to display the data in a grouped data frequency distribution? b. Referring to part a, what should the class width be, assuming you round the width up to the nearest 1,000 passengers? c. Referring to parts a and b, develop a grouped data frequency distribution for these airport data. (Start the first class at 0.) (Simplify your answers.) Number Of Passengers Frequency and under and under and under and under and under and under d. Based on your answer to part c, construct and interpret a frequency histogram for the data. Construct the frequency histogram. Choose the correct graph below. в. 15- 312.000 624.000 Number Of Passengers 312.000 624.000 Number Of Passengers 312.000 624,000 Number Of Passenger What is the correct interpretation of the frequency histogram? A. A majority of all airlines have less than 104,000 passengers per month at all airports. B. Only a few airlines have more than 104,000 passengers per month at any given airport. C. A majority of the airlines surveyed have less than 104,000 passengers per month at this particular airport. O D. Most of the airlines have more than 104,000 passengers per month at this particular airport. Aouanba kouanbe Kouanbe


Inverse Normal Distribution
The method used for finding the corresponding z-critical value in a normal distribution using the known probability is said to be an inverse normal distribution. The inverse normal distribution is a continuous probability distribution with a family of two parameters.
Mean, Median, Mode
It is a descriptive summary of a data set. It can be defined by using some of the measures. The central tendencies do not provide information regarding individual data from the dataset. However, they give a summary of the data set. The central tendency or measure of central tendency is a central or typical value for a probability distribution.
Z-Scores
A z-score is a unit of measurement used in statistics to describe the position of a raw score in terms of its distance from the mean, measured with reference to standard deviation from the mean. Z-scores are useful in statistics because they allow comparison between two scores that belong to different normal distributions.


Trending now
This is a popular solution!

Step by step
Solved in 5 steps with 1 images


