11. Tri-State Smokers. A Gallup Poll of U.S. adults indicated that Kentucky is the state with the highest percentage of smokers (Gallup website). Consider the following example data from the Tri-State region, an area that comprises northern Kentucky, southeastern Indiana, and southwestern Ohio. State Smoker Non-Smoker Kentucky Indiana 47 176 32 134 Ohio 39 182 Total: 118 492 a. Use the data to compute the probability that an adult in the Tri-State region smokes. b. What is the probability of an adult in each state of the Tri-State region being a smoker? Which state in the Tri-State region has the lowest probability of an adult being a smoker?
11. Tri-State Smokers. A Gallup Poll of U.S. adults indicated that Kentucky is the state with the highest percentage of smokers (Gallup website). Consider the following example data from the Tri-State region, an area that comprises northern Kentucky, southeastern Indiana, and southwestern Ohio. State Smoker Non-Smoker Kentucky Indiana 47 176 32 134 Ohio 39 182 Total: 118 492 a. Use the data to compute the probability that an adult in the Tri-State region smokes. b. What is the probability of an adult in each state of the Tri-State region being a smoker? Which state in the Tri-State region has the lowest probability of an adult being a smoker?

Holt Mcdougal Larson Pre-algebra: Student Edition 2012
1st Edition
ISBN:9780547587776
Author:HOLT MCDOUGAL
Publisher:HOLT MCDOUGAL
Chapter11: Data Analysis And Probability
Section11.5: Interpreting Data
Problem 1C

Related questions
Question
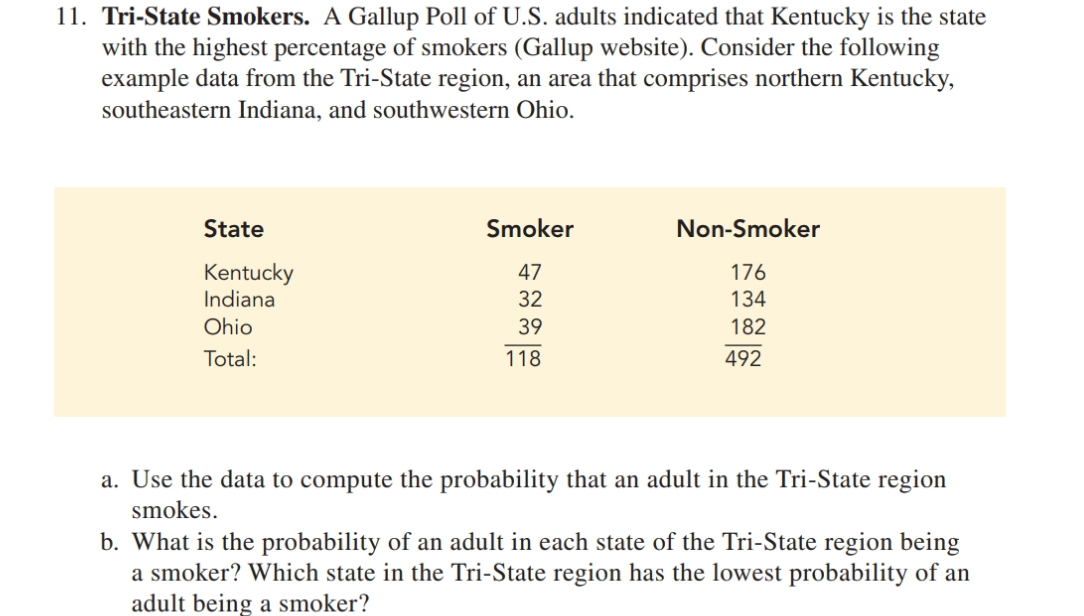
Transcribed Image Text:11. Tri-State Smokers. A Gallup Poll of U.S. adults indicated that Kentucky is the state
with the highest percentage of smokers (Gallup website). Consider the following
example data from the Tri-State region, an area that comprises northern Kentucky,
southeastern Indiana, and southwestern Ohio.
State
Smoker
Non-Smoker
Kentucky
Indiana
47
176
32
134
Ohio
39
182
Total:
118
492
a. Use the data to compute the probability that an adult in the Tri-State region
smokes.
b. What is the probability of an adult in each state of the Tri-State region being
a smoker? Which state in the Tri-State region has the lowest probability of an
adult being a smoker?
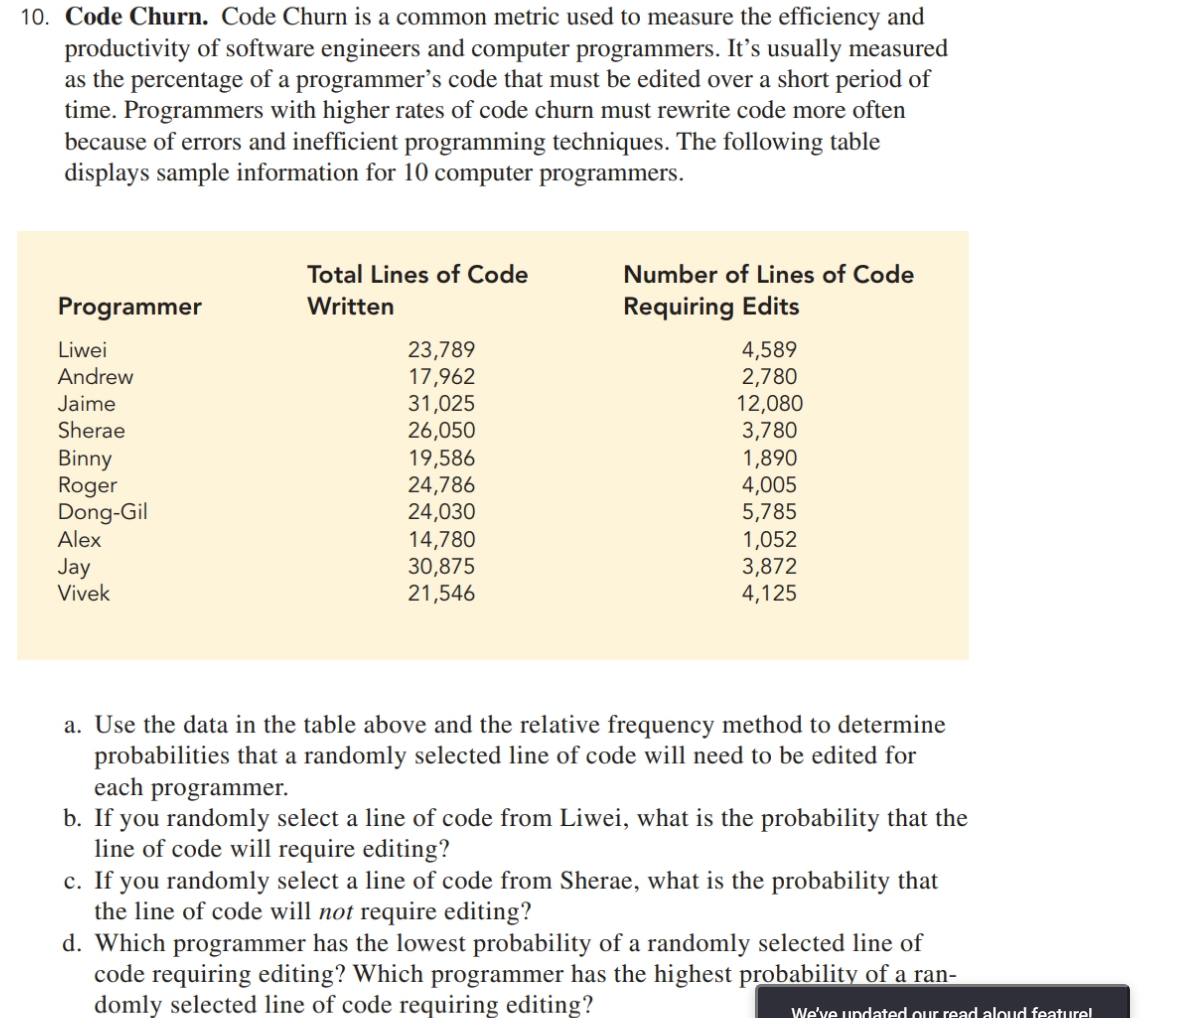
Transcribed Image Text:10. Code Churn. Code Churn is a common metric used to measure the efficiency and
productivity of software engineers and computer programmers. It's usually mea
as the percentage of a programmer's code that must be edited over a short period of
time. Programmers with higher rates of code churn must rewrite code more often
because of errors and inefficient programming techniques. The following table
displays sample information for 10 computer programmers.
sured
Total Lines of Code
Number of Lines of Code
Programmer
Written
Requiring Edits
4,589
2,780
12,080
3,780
1,890
4,005
5,785
1,052
3,872
4,125
Liwei
23,789
17,962
31,025
26,050
19,586
24,786
24,030
14,780
30,875
21,546
Andrew
Jaime
Sherae
Binny
Roger
Dong-Gil
Alex
Jay
Vivek
a. Use the data in the table above and the relative frequency method to determine
probabilities that a randomly selected line of code will need to be edited for
each programmer.
b. If you randomly select a line of code from Liwei, what is the probability that the
line of code will require editing?
c. If you randomly select a line of code from Sherae, what is the probability that
the line of code will not require editing?
d. Which programmer has the lowest probability of a randomly selected line of
code requiring editing? Which programmer has the highest probability of a ran-
domly selected line of code requiring editing?
We've undated our read aloud featurel
Expert Solution
This question has been solved!
Explore an expertly crafted, step-by-step solution for a thorough understanding of key concepts.

This is a popular solution!

Trending now
This is a popular solution!

Step by step
Solved in 3 steps

Knowledge Booster


Learn more about
Need a deep-dive on the concept behind this application? Look no further. Learn more about this topic, statistics and related others by exploring similar questions and additional content below.Recommended textbooks for you
Holt Mcdougal Larson Pre-algebra: Student Edition…
Algebra
ISBN:
9780547587776
Author:
HOLT MCDOUGAL
Publisher:
HOLT MCDOUGAL
Holt Mcdougal Larson Pre-algebra: Student Edition…
Algebra
ISBN:
9780547587776
Author:
HOLT MCDOUGAL
Publisher:
HOLT MCDOUGAL