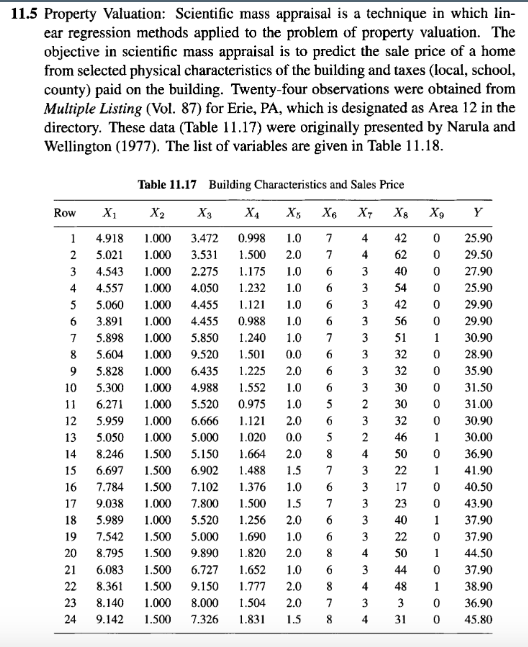
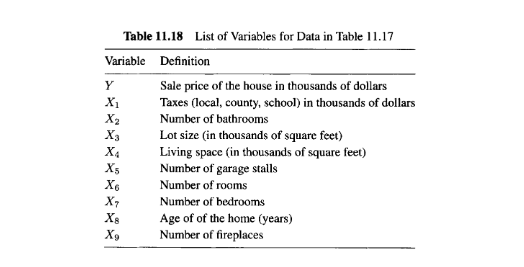
11.5 Property Valuation: Scientific mass appraisal is a technique in which lin- ear regression methods applied to the problem of property valuation. The objective in scientific mass appraisal is to predict the sale price of a home from selected physical characteristics of the building and taxes (local, school, county) paid on the building. Twenty-four observations were obtained from Multiple Listing (Vol. 87) for Erie, PA, which is designated as Area 12 in the directory. These data (Table 11.17) were originally presented by Narula and Wellington (1977). The list of variables are given in Table 11.18. Table 11.17 Building Characteristics and Sales Price х, X2 X, X, Xв Хо Row X3 X4 X7 4.918 1.000 3.472 0.998 1.0 42 25.90 5.021 1.000 3.531 1.500 2.0 62 29.50 4.543 1.000 2.275 1.175 1.0 6. 3 40 27.90 4 4.557 1.000 4.050 1.232 1.0 6. 54 25.90 5.060 1.000 4.455 1.121 1.0 6. 42 29.90 6. 3.891 1.000 4.455 0.988 1.0 56 29.90 5.898 1.000 5.850 1.240 1.0 3 51 30.90 8. 5.604 1.000 9.520 1.501 0.0 6. 3 32 28.90 5.828 1.000 6.435 1.225 2.0 6. 3 32 35.90 1.000 1.000 10 5.300 4.988 1.552 1.0 30 31.50 11 6.271 5.520 0.975 1.0 30 31.00 12 5.959 1.000 6.666 1.121 2.0 32 30.90 13 5.050 1.000 5.000 1.020 0.0 46 30.00 14 8.246 1.500 5.150 1.664 2.0 4 50 36.90 15 6.697 1.500 6.902 1.488 1.5 22 41.90 16 7.784 1.500 7.102 1.376 1.0 6. 3 17 40.50 17 9.038 1.000 7.800 1.500 1.5 3 23 43.90 18 5.989 1.000 5.520 1.256 2.0 40 37.90 19 7.542 1.500 5.000 1.690 1.0 3 22 37.90 20 8.795 1.500 9.890 1.820 2.0 4 50 44,50 21 6.083 1.500 6.727 1.652 1.0 44 37.90 22 8.361 1.500 9.150 1.777 2.0 8. 4 48 38.90 23 8.140 1.000 8.000 1.504 2.0 36.90 24 9.142 1.500 7.326 1.831 1.5 8. 31 45.80 Table 11.18 List of Variables for Data in Table 11.17 Variable Definition Sale price of the house in thousands of dollars X1 Taxes (local, county, school) in thousands of dollars X2 X3 Number of bathrooms Lot size (in thousands of square feet) X4 X5 Living space (in thousands of square feet) Number of garage stalls Хв Number of rooms X7 Хв Number of bedrooms Age of of the home (years) Number of fireplaces X9


Correlation
Correlation defines a relationship between two independent variables. It tells the degree to which variables move in relation to each other. When two sets of data are related to each other, there is a correlation between them.
Linear Correlation
A correlation is used to determine the relationships between numerical and categorical variables. In other words, it is an indicator of how things are connected to one another. The correlation analysis is the study of how variables are related.
Regression Analysis
Regression analysis is a statistical method in which it estimates the relationship between a dependent variable and one or more independent variable. In simple terms dependent variable is called as outcome variable and independent variable is called as predictors. Regression analysis is one of the methods to find the trends in data. The independent variable used in Regression analysis is named Predictor variable. It offers data of an associated dependent variable regarding a particular outcome.
Scientific mass appraisal is a technique in which linear regression
methods applied to the problem of property valuation. The objective in
the Scientific Mass Appraisal is to predict the sale price of a home from
selected characteristics of the building and taxes paid on the building
Twenty four observations were obtained. The list of variables is also
given.
Answer the following questions, in each case justifying your answer by
appropriate analyses.
(a) In a fitted regression model that relates the sale price to taxes
and building characteristics, would you include all the
variables?
(b) A veteran real estate agent has suggested that local taxes,
number of rooms and age of the house would adequately
describe the sale price . Do you agree ?
(c) A real estate expert who who was brought into the project
reasoned as follows:
“ The selling price of a home is determined by its desirability
and this is certainly a
the building. This overall assessment is reflected in the local
taxes paid by the homeowner consequently the best predictor of
the sale price is the local taxes. The building characteristics are
therefore redundant in a regression equation which includes
taxes.”
Examine this assertion by examining several models. Do you
agree? Present what you consider to be the most adequate model
or models for predicting sale price of homes.


Trending now
This is a popular solution!

Step by step
Solved in 3 steps with 4 images


