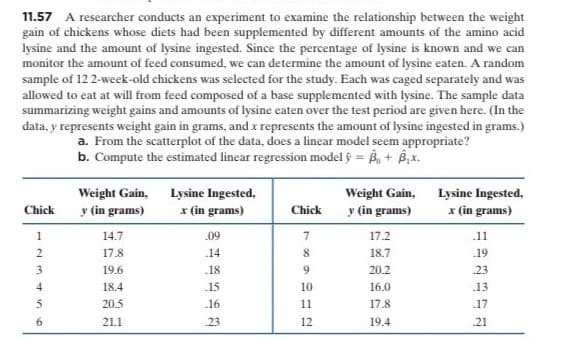
11.57 A researcher conducts an experiment to examine the relationship between the weight gain of chickens whose diets had been supplemented by different amounts of the amino acid lysine and the amount of lysine ingested. Since the percentage of lysine is known and we can monitor the amount of feed consumed, we can determine the amount of lysine eaten. A random sample of 12 2-week-old chickens was selected for the study. Each was caged separately and was allowed to eat at will from feed composed of a base supplemented with lysine. The sample data summarizing weight gains and amounts of lysine eaten over the test period are given here. (In the data, y represents weight gain in grams, and x represents the amount of lysine ingested in grams.) a. From the scatterplot of the data, does a linear model seem appropriate? b. Compute the estimated linear regression model ý = B, + B,x. Weight Gain, y (in grams) Lysine Ingested, x (in grams) Weight Gain, Lysine Ingested, x (in grams) Chick Chick y (in grams) 1 14.7 .09 7. 17.2 .11 2. 17.8 14 18.7 .19 3. 19.6 .18 9 20.2 23 4 18.4 15 10 16.0 13 5 20.5 .16 11 17.8 .17 6. 21.1 23 12 19.4 21
11.57 A researcher conducts an experiment to examine the relationship between the weight gain of chickens whose diets had been supplemented by different amounts of the amino acid lysine and the amount of lysine ingested. Since the percentage of lysine is known and we can monitor the amount of feed consumed, we can determine the amount of lysine eaten. A random sample of 12 2-week-old chickens was selected for the study. Each was caged separately and was allowed to eat at will from feed composed of a base supplemented with lysine. The sample data summarizing weight gains and amounts of lysine eaten over the test period are given here. (In the data, y represents weight gain in grams, and x represents the amount of lysine ingested in grams.) a. From the scatterplot of the data, does a linear model seem appropriate? b. Compute the estimated linear regression model ý = B, + B,x. Weight Gain, y (in grams) Lysine Ingested, x (in grams) Weight Gain, Lysine Ingested, x (in grams) Chick Chick y (in grams) 1 14.7 .09 7. 17.2 .11 2. 17.8 14 18.7 .19 3. 19.6 .18 9 20.2 23 4 18.4 15 10 16.0 13 5 20.5 .16 11 17.8 .17 6. 21.1 23 12 19.4 21

Glencoe Algebra 1, Student Edition, 9780079039897, 0079039898, 2018
18th Edition
ISBN:9780079039897
Author:Carter
Publisher:Carter
Chapter10: Statistics
Section10.5: Comparing Sets Of Data
Problem 13PPS

Related questions
Question
i need Q6 answer other pic is just for refernece
Transcribed Image Text:QUESTION 6
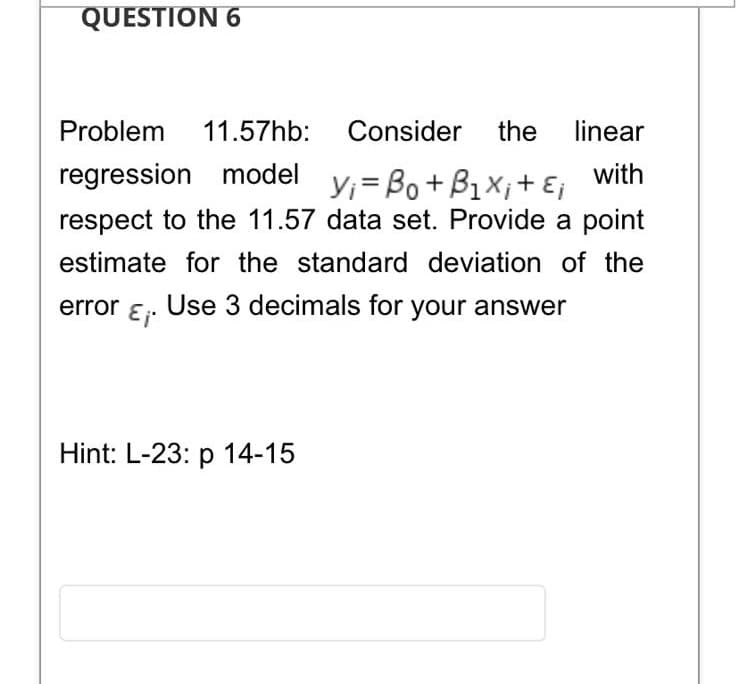
Problem
11.57hb: Consider the
linear
regression model
with
Y;=Bo+ B1X;+ Ej
respect to the 11.57 data set. Provide a point
estimate for the standard deviation of the
error ɛ. Use 3 decimals for your answer
Hint: L-23: p 14-15
Transcribed Image Text:11.57 A researcher conducts an experiment to examine the relationship between the weight
gain of chickens whose diets had been supplemented by different amounts of the amino acid
lysine and the amount of lysine ingested. Since the percentage of lysine is known and we can
monitor the amount of feed consumed, we can determine the amount of lysine eaten. A random
sample of 12 2-week-old chickens was selected for the study. Each was caged separately and was
allowed to eat at will from feed composed of a base supplemented with lysine. The sample data
summarizing weight gains and amounts of lysine eaten over the test period are given here. (In the
data, y represents weight gain in grams, and x represents the amount of lysine ingested in grams.)
a. From the scatterplot of the data, does a linear model seem appropriate?
b. Compute the estimated linear regression model ý = B, + B,x.
Weight Gain,
y (in grams)
Lysine Ingested,
x (in grams)
Weight Gain, Lysine Ingested,
x (in grams)
Chick
Chick
y (in grams)
1
14.7
.09
7.
17.2
.11
17.8
.14
18.7
.19
3.
19.6
.18
9
20.2
23
4
18.4
15
10
16.0
13
5
20.5
.16
11
17.8
.17
6.
21.1
23
12
19.4
21
Expert Solution
This question has been solved!
Explore an expertly crafted, step-by-step solution for a thorough understanding of key concepts.

This is a popular solution!

Trending now
This is a popular solution!

Step by step
Solved in 3 steps with 3 images

Recommended textbooks for you
Glencoe Algebra 1, Student Edition, 9780079039897…
Algebra
ISBN:
9780079039897
Author:
Carter
Publisher:
McGraw Hill
Glencoe Algebra 1, Student Edition, 9780079039897…
Algebra
ISBN:
9780079039897
Author:
Carter
Publisher:
McGraw Hill