1115 865 1015 885 1594 1000 1416 1501 1310 2130 845 1223 2023 1820 1560 1238 1540 1421 1674 375 1315 1940 1055 990 1502 1109 1016 2265 1269 1120 1764 1468
Q: 6964 .860 26, 446 14.860 26. 446 5o, 274 1d, o27 a 26,446 h0,2 74
A:
Q: 78 67 101 105 76 66 70 88 65 89 77 111 89 74 112 102 68 62 99 82 94 98 114 94 108 87 77 104 87 93 96…
A: The following data is given, 62 70 79 88 93 98 104 62 73 82 89 93 98 105 63 73 82 89 94 99…
Q: 106 107 76 82 109 107 115 93 187 95 123 125 11 92 86 70 126 68 130 129 139 119 115 128 100 186 84 99…
A: There are total 60 observation
Q: Data Set I 106 Data Set II 106 85 100 Data Set III 106 85 123 123 90 84 123 90 89 89 109 82 89 109…
A: DS I 106 123 89 129 88 75 75 109 DS II 106 123…
Q: On- Early Late Total time Airline 133 416 155 704 1 Airline 58 354 88 500 Total 191 770 243 1204
A: proportion of flights late in Airline 1 = p^1 = 155243 proportion of flights late in Airline 2 = p^2…
Q: Use Excel to develop a regression model for the Hospital Database (using the "Excel Databases.xls"…
A: The given data represents the 200 hospitals births and their number of Personnel.
Q: Use Excel to develop a regression model for the Hospital Database (using the "Excel Databases.xls"…
A: Given: n=200 Hypothesis H0:β1=0 H0: The number of births is not significant in predicting the…
Q: [1 0 -4 -6 е. 1 X -8 6. 10 -6 2 8 -9 X =
A: Since you have posted a multiple question according to guildlines I will solve first question(Q.e)…
Q: 130,000 150,000 180,000 200,000 960 230 1,150 1,900 2,100 210 165 120
A:
Q: 4285 564 1278 205 3920 2066 604 209 602 1379 2574 14 349 3770 99 1009 4152 478 726 510 318 737 3032…
A: Data :…
Q: APPLE is the stock. For the stock selected, pull historical monthly prices from an online source for…
A: "Since you have posted a question with multiple sub-parts, we will solve the first three sub-parts…
Q: 120 165 180 200 212 232 120 170 182 200 212 232 125 172 185 200 215 235 130 175 185 202 215 235 140…
A: The values which divide a frequency distribution of a variable into four equal parts, are said to be…
Q: 70 80 90 100 80 B 120 130 140 150 160 170 60 50 40 3o 20 10 170 160 150 140 130 120 10 20 30 40 50…
A: ANGLE B G E is
Q: Calculator limits Use a calculator to make a table similar to Table 7.1 to approximate the following…
A: We make tables for the given limit h ln(1+h)h 0.1 0.953101798043 0.01 0.995033085317 0.001…
Q: Sunday 30 Monday 24 Tuesday 31 Wednesday 24 Thursday 28 Eriday 33
A: Given data, N=total frequency=182n=number of outcomes=number of days=7 The main objective is to find…
Q: Observed 6 Total 3 66 5 86 216 4 7 Male 69 76 15 26 563 654 20 91 Female 83 54 163 142 467 169 181…
A: ANOVA: The analysis of variance (ANOVA) is used to determine whether there are any statistically…
Q: 6
A:
Q: 296.544 33.492 -173.52 26.793 56.427 -1.869 -31365 -1.776 262.995 21.603 177.657 -34.002
A: Given
Q: Calculator limits Use a calculator to make a table similar to Table 7.1 to approximate the following…
A: Given that limh→01+3h2h. Table the function values of y=1+3x2x as shown below. Thus,…
Q: Year 1979 1980 1981 1982 1983 Pups Born (thousands) 245.93 203.82 179.44 203.58 165.94 Year 1988…
A: Year Pups Born 1979 245.93 1980 203.82 1981 179.44 1982 203.58 1983 165.94 1984 173.27…
Q: 137 159 122 183 140 146 184 131 161 126 114 142 110 105 150 138 171 106 153 155 137 180 122 170 155…
A: The histogram is a graph for continuous frequency distribution,it is a set of adjacent rectangles,…
Q: 775 1065 896 930 1052 846 949 797 1041 962 1028 910 1067 982 879 1097…
A: Conditions for construction of hypothesis test: For a given dataset, the hypothesis test for a given…
Q: 128 119 95 97 124 128 142 98 108 120 113 109 124 132 97 138 133 136 120 112 146 128 103 135 114 109…
A: Given data:
Q: Ep1(90 + 1) (iii) Epo(9o + 91) Χ 100 Ep1 V9091 (iv) Epo vg091 Χ 100
A:
Q: 1. X 1 7 P(X) 4 8 4 8 2. 3 6. P(X) 6. 3. P(X) 0.35 0.25 0.22 0.12 419 4113 116 2116 3.
A: Here AS PER POLICY I HAVE CALCULATED FIRST 3 SUBPART PLZ REPOST FOR REMAINING here for valid…
Q: 1800 978 1850 1,262 1900 1,650 1950 2,519 1960 2,982 1970 3,692 1980 4,435 1985 4,831 1990 5,263…
A: Taking the rate of increment as exponential first fits an exponential function to the given data.…
Q: Data Set I 106 Data Set II 106 85 100 Data Set III 106 85 100 105 123 123 90 84 123 90 84 77 89 89…
A:
Q: 8.000000 26.5000 26.0000 107.7500 107. 7500 494-8750 107.7500 494.8750 2453.188 a. a₁ az 8.460622…
A:
Q: Use Excel to develop a regression model for the Hospital Database (using the "Excel Databases.xls"…
A: Regression model is Y^=β0 ^+ β1^ XWhere,Y^ : Predicted response variableβ0 ^ & β1^ are…
Q: Hospital Births Personnel
A: We have used the excel data analysis tool to run the regression analysis.
Q: $8,400.00 $23.00 $38.00 $0.00 $0.00 $128,000.00 $490.00 1,090 $0.00 $0.00 $0.00 $750.00 $80.00 25…
A: In the first row, we can form a function for total cost and it is TC(x) = 23x+8400 and the revenue…
Q: Boston 860 San Francisco 1855 Chicago 191 908 722 New York 957 Denver 1736 349 1372 Los Angeles 1235…
A:
Q: Test whether departure time(DPETTIME) differs depending on intrusion condition. Use the 0.05…
A: Use the given table to form excel table: x (Intrusion = 0) x-x¯ x-x¯2 y(Intrusion = 1)…
Q: 1 1 1 2 1 3 3 1 1 4 4 1 10 10 1 1 15 20 15 1 21 | 35 35 21 1 8 28 56 56 28 8. 1 1 36 84 84 36 1 45…
A:
Q: 11. 5.024 = 1256 131 25 314 25 628 4- 2- 625 125
A: Topic:- simplification
Q: Boston 860 San Francisco 1855 Chicago 957 908 722 / 191 349 Denve 798 645 New LA 1372 York 1235…
A: Solution :-
Q: 900,000 + 390(60,001) + 0.0004(60,001)2
A: Given, We have to add 900,000 + 390(60,001) + 0.0004(60,001)2 = 900,000 + 60,001 (390 + 0.0004 *…
Q: FM test 1% sales day1 day1 day3 day4 1 80 90 70 65 2 90 88 90 56 3 99 88 70 72 4 30 44 44 32 5 88 77…
A:
Q: tn 12.20 In 1 1928 1932 11.90 3 1936 11.50 4 1948 11.90 1952 11.50 1956 11.50 7 1960 11.00 8. 1964…
A:
Q: Number Chart (1 to 200) 1 2 3 4 5 6 | 7 | 8 | 9 10 16| 17 18| 19| 20 26 | 27 28 29 30 36 37 38 39 40…
A:
Q: Consider the following excerpt from a life table. 45 9799 46 9734 47 9683 48 9607 49 9514
A: Hi! Thank you for the question, As per the honor code, we are allowed to answer three sub-parts at a…
Q: 120 135 06 90 75 (4) 106 90 75 120 135 45 45 130 30 150 30 165 15 165 15 180 180 195 315 195 315 210…
A: Given data is : -π3≤θ≤-π6 -2<r≤3
Q: 18 135 15 90 78 69 98 102 83 55 28 121 120 13 22 124 112 70 66 74 89 103 24 21 112 21 98 87 132 115…
A:
Q: 20-29 8 10 27 43 88 17.74 *** 26.20 23.62 30-39 29 26 38 22 23.18 26.72 34.24 30.86 40-49 33 32 72…
A: Answer:----. Date:----26/10/2021
Q: d. Standard deviation of the sample data: Generate the histogram for the data using the given bin…
A: Given : data 7065 6870 6858 6641 6306 6671 6663 6492 6569 6601 6653 6729…
Q: 75 349 414 345 170 219 260 361 204 143 327 40 143 179 101 161 209 30 117 437 127 140 94 40 221 42…
A:
Q: 220 215 210 205 200 195 190 185 180 175 170 165 160 155 150 145 140 135 130 125 120 115 110 105 100…
A: the Sine function is of the form y=Asin(B(x-c)+D). Substitute the maximum and minimum value of the…
Q: [1 10 100 1000 do [227.04 1 15 225 3375 a 362.78 1 20 400 8000 | a2 517.35 1 22.5 506.25 11391 a,…
A:
Q: 775 1065 896 930 1052 846 949 797 1041 962 1028 910 1067 982 879 1097…
A: The hypotheses for this test can be constructed as: H0: µ = $1967 H1: µ < $1967 Sample size (n)…
Q: Sales Accounts Marketing Repairs Total 10 17.74 20-29 27 43 88 23.62 *** 26.20 30-39 29 26 38 22…
A: d) Assumptions for Chi-square test: Sample drawn from the normal population. The categories of the…
Please provide an excel file for the given data, thank you!
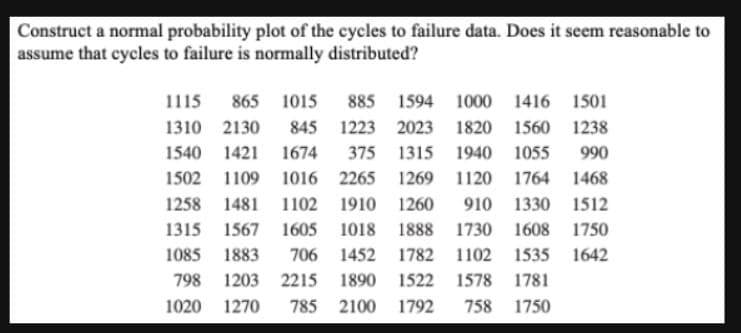
Step by step
Solved in 3 steps with 1 images