
MATLAB: An Introduction with Applications
6th Edition
ISBN: 9781119256830
Author: Amos Gilat
Publisher: John Wiley & Sons Inc
expand_more
expand_more
format_list_bulleted
Related questions
Question
| Hospital | Births | Personnel |
| 1 | 312 | 792 |
| 2 | 1077 | 1762 |
| 3 | 1027 | 2310 |
| 4 | 355 | 328 |
| 5 | 168 | 181 |
| 6 | 3810 | 1077 |
| 7 | 735 | 742 |
| 8 | 1 | 131 |
| 9 | 1733 | 1594 |
| 10 | 257 | 233 |
| 11 | 169 | 241 |
| 12 | 430 | 203 |
| 13 | 0 | 325 |
| 14 | 2049 | 676 |
| 15 | 211 | 347 |
| 16 | 16 | 79 |
| 17 | 2648 | 505 |
| 18 | 2450 | 1543 |
| 19 | 1465 | 755 |
| 20 | 0 | 959 |
| 21 | 1993 | 325 |
| 22 | 2275 | 954 |
| 23 | 1494 | 1091 |
| 24 | 1313 | 671 |
| 25 | 451 | 300 |
| 26 | 1689 | 753 |
| 27 | 1583 | 607 |
| 28 | 2017 | 929 |
| 29 | 995 | 354 |
| 30 | 2045 | 408 |
| 31 | 1686 | 1251 |
| 32 | 503 | 386 |
| 33 | 126 | 144 |
| 34 | 2026 | 2047 |
| 35 | 1412 | 1343 |
| 36 | 1517 | 1723 |
| 37 | 0 | 96 |
| 38 | 0 | 529 |
| 39 | 2719 | 3694 |
| 40 | 1074 | 1042 |
| 41 | 1421 | 1071 |
| 42 | 762 | 1525 |
| 43 | 3194 | 1983 |
| 44 | 496 | 670 |
| 45 | 1442 | 1653 |
| 46 | 0 | 167 |
| 47 | 1107 | 793 |
| 48 | 2989 | 841 |
| 49 | 113 | 316 |
| 50 | 0 | 93 |
| 51 | 0 | 373 |
| 52 | 173 | 263 |
| 53 | 1064 | 943 |
| 54 | 759 | 605 |
| 55 | 1317 | 596 |
| 56 | 1751 | 1165 |
| 57 | 0 | 568 |
| 58 | 0 | 507 |
| 59 | 714 | 479 |
| 60 | 99 | 136 |
| 61 | 2243 | 1456 |
| 62 | 3966 | 3486 |
| 63 | 1308 | 885 |
| 64 | 0 | 243 |
| 65 | 2514 | 1001 |
| 66 | 3714 | 3301 |
| 67 | 126 | 337 |
| 68 | 556 | 1193 |
| 69 | 1327 | 1161 |
| 70 | 415 | 322 |
| 71 | 216 | 185 |
| 72 | 339 | 205 |
| 73 | 1217 | 1224 |
| 74 | 2641 | 1704 |
| 75 | 790 | 815 |
| 76 | 520 | 712 |
| 77 | 35 | 156 |
| 78 | 1168 | 1769 |
| 79 | 793 | 875 |
| 80 | 0 | 790 |
| 81 | 0 | 308 |
| 82 | 14 | 70 |
| 83 | 0 | 494 |
| 84 | 0 | 111 |
| 85 | 0 | 1618 |
| 86 | 0 | 244 |
| 87 | 776 | 525 |
| 88 | 451 | 472 |
| 89 | 0 | 94 |
| 90 | 145 | 297 |
| 91 | 1284 | 847 |
| 92 | 1 | 234 |
| 93 | 319 | 401 |
| 94 | 2154 | 3928 |
| 95 | 295 | 198 |
| 96 | 496 | 1231 |
| 97 | 589 | 545 |
| 98 | 806 | 663 |
| 99 | 701 | 820 |
| 100 | 3968 | 2581 |
| 101 | 0 | 1298 |
| 102 | 0 | 126 |
| 103 | 3655 | 2534 |
| 104 | 0 | 251 |
| 105 | 0 | 85 |
| 106 | 0 | 432 |
| 107 | 0 | 864 |
| 108 | 0 | 66 |
| 109 | 3063 | 556 |
| 110 | 169 | 347 |
| 111 | 66 | 239 |
| 112 | 827 | 973 |
| 113 | 570 | 439 |
| 114 | 0 | 1849 |
| 115 | 0 | 102 |
| 116 | 0 | 262 |
| 117 | 342 | 885 |
| 118 | 494 | 549 |
| 119 | 0 | 611 |
| 120 | 0 | 330 |
| 121 | 0 | 1471 |
| 122 | 0 | 75 |
| 123 | 286 | 262 |
| 124 | 235 | 328 |
| 125 | 339 | 377 |
| 126 | 398 | 575 |
| 127 | 1275 | 1916 |
| 128 | 5699 | 2620 |
| 129 | 1364 | 571 |
| 130 | 714 | 703 |
| 131 | 0 | 535 |
| 132 | 0 | 160 |
| 133 | 0 | 202 |
| 134 | 779 | 1330 |
| 135 | 0 | 370 |
| 136 | 2202 | 3123 |
| 137 | 3346 | 2745 |
| 138 | 1071 | 815 |
| 139 | 352 | 576 |
| 140 | 254 | 502 |
| 141 | 0 | 808 |
| 142 | 0 | 50 |
| 143 | 699 | 728 |
| 144 | 2462 | 4087 |
| 145 | 3311 | 3012 |
| 146 | 0 | 68 |
| 147 | 4207 | 3090 |
| 148 | 0 | 1358 |
| 149 | 339 | 576 |
| 150 | 130 | 284 |
| 151 | 91 | 145 |
| 152 | 1143 | 2312 |
| 153 | 0 | 1124 |
| 154 | 0 | 336 |
| 155 | 509 | 415 |
| 156 | 1026 | 1779 |
| 157 | 0 | 338 |
| 158 | 447 | 453 |
| 159 | 1161 | 437 |
| 160 | 0 | 261 |
| 161 | 922 | 609 |
| 162 | 562 | 647 |
| 163 | 78 | 61 |
| 164 | 0 | 2074 |
| 165 | 2122 | 2232 |
| 166 | 0 | 948 |
| 167 | 0 | 409 |
| 168 | 0 | 153 |
| 169 | 710 | 741 |
| 170 | 1165 | 1625 |
| 171 | 466 | 538 |
| 172 | 1106 | 789 |
| 173 | 376 | 395 |
| 174 | 0 | 956 |
| 175 | 637 | 362 |
| 176 | 0 | 144 |
| 177 | 352 | 229 |
| 178 | 447 | 396 |
| 179 | 1227 | 2256 |
| 180 | 963 | 731 |
| 181 | 3038 | 1477 |
| 182 | 0 | 102 |
| 183 | 0 | 106 |
| 184 | 868 | 939 |
| 185 | 1189 | 392 |
| 186 | 2849 | 3516 |
| 187 | 1728 | 785 |
| 188 | 2171 | 607 |
| 189 | 364 | 273 |
| 190 | 0 | 630 |
| 191 | 2993 | 1379 |
| 192 | 0 | 1108 |
| 193 | 1964 | 583 |
| 194 | 601 | 514 |
| 195 | 387 | 216 |
| 196 | 1946 | 1593 |
| 197 | 545 | 1055 |
| 198 | 0 | 399 |
| 199 | 838 | 834 |
| 200 | 51 | 104 |
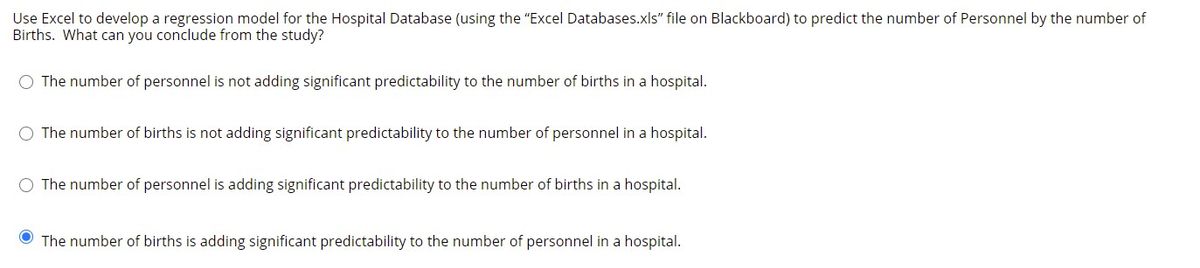

Transcribed Image Text:Use Excel to develop a regression model for the Hospital Database (using the "Excel Databases.xls" file on Blackboard) to predict the number of Personnel by the number of
Births. What can you conclude from the study?
O The number of personnel is not adding significant predictability to the number of births in a hospital.
O The number of births is not adding significant predictability to the number of personnel in a hospital.
O The number of personnel is adding significant predictability to the number of births in a hospital.
O The number of births is adding significant predictability to the number of personnel in a hospital.
Expert Solution
This question has been solved!
Explore an expertly crafted, step-by-step solution for a thorough understanding of key concepts.

This is a popular solution

Trending nowThis is a popular solution!

Step by stepSolved in 2 steps with 1 images

Knowledge Booster


Learn more about
Need a deep-dive on the concept behind this application? Look no further. Learn more about this topic, statistics and related others by exploring similar questions and additional content below.Similar questions
- Incomes 29109 21546 30417 10104 19279 27578 23581 26949 35423 12971 37895 31308 28256 31494 31552 34440 33347 26768 25225 29250 23437 31921 19869 31693 38974 34767 33131 23815 26714 36735 33136 34007 39674 22759 27323 28875 37991 23100 29289 21065 20760 25332 28665 21338 33246 27501 1327 39562 30752 21887 32228 10133 25943 38223 38362 27569 38213 25181 29607 29690 27114 27497 36364 35330 45575 33222 15717 21607 28861 22407 11334 18836 13190 26210 14940 48983 21182 29351 27038 19260 32626 31240 13790 23167 19559 53556 21745 24758 20145 37975 22640 28622 24653 25567 19951 11195 30646 25490 17034 31027 32939 26919 27831 23640 20727 23450 17718 37815 27443 26913 27273 34833 27059 36773 10541 36607 22582 24738 31808 45441 36924 17833 24812 27882…arrow_forward42. FILE Car_Price. The accompanying table shows a portion of data consisting of the selling price, the age, and the mileage for 20 used sedans. Mileage 61485 54344 Price 13590 13775 ⠀ 11988 Age 6 6 ⠀ 8 42408 a. Construct a scatterplot of Price against Age. Describe the relationship. b. Construct a scatterplot of Price against Mileage. Describe the relationship. c. Convert Mileage into a categorical variable, Mileage_Category, by assigning all cars with less than 50,000 miles to the "Low_Mileage" category page 68 and the rest to the "High_Mileage" category. How many cars are in the "High_Mileage" category? d. Construct a scatterplot using Price, Age, and Mileage Category. Use different colors or symbols to show cars that belong to the different mileage categories. Describe the relationships between price, age, and mileage of these used sedans. Does the relationship between price and age hold true for both mileage categories? :arrow_forwardA certain newspaper provides the net asset value, the year-to-date percent return, and the three-year percent.return for 882.mutual funds at the end of 2017. Assume that a simple random sample of 12 of the 882 mutual funds will be selected for a follow-up study on the size and performance of mutual funds. Use the ninth column of the table of random numbers, beginning with 13554, to select the simple random sample of 12 mutual funds. Begin with mutual fund 554 and use the last three digits in each row of column 9 for your selection process. What are the numbers of the 12 mutual funds in the simple random sample? (Enter your answers as a comma-separated list.)arrow_forward
- Classes 10 11 13 6 8 13 9 10 6 13 14 9 7 10 8 12 10 12 10 10 10 8 7 12 12 10 10 12 10 12 11 10 7 12 6 12 13 12 10 11 10 11 10 11 15 8 12 9 11 11 9 8 9 9 17 10 8 12 9 8 12 11 9 10 11 9 12 10 11 14 8 8 14 8 12 3 11 8 8 11 12 10 8 8 10 11 7 11 11 12 9 10 11 9 13 12 7 12 10 13 USE EXCEL with explanation pleasearrow_forwardZip Code 93905 93905 93905 93905 93905 93905 93905 93905 93905 93905 93905 93905 93905 93905 405 93905 760 4 93905 630 4 93905 from ho 640 ales above, 3 93905eath ip 749 find: sampl 4 93905 503 3 93905 43908 93906 93906 93906 93906 93906 93906 93906 93906 93906 93906 93906 93906 93906 93906 93906 93906 93906 Price 714 855 598 769 529 795 715 635 989 93901 93901 93901 93901 790 605 800 480 660 799 900 799 640 650 93906 do the 1069 93906 700 93906 819 635 850 840 625 730 728 840 845 785 700 609 739 685 675 565 595 Bedrooms 3 5 3 4 2 5 3 4 6 4 3 5 3 2 3 3 4 6 3 3 2 4 3 4 3 4 4 3 4 4 4 3 2 3 3322 Baths 1 3 3 3 1 3 2 3 3 3 1 3 1 1 3 2 13 abd 3 1 3 3 2 3 3 2 2 2 3 2 3 2 3 3 2 3 3 3 3 2 3 2 2 1 1 Square Feet 821 2658 1638 2607 729 2253 1529 1980 3074 2607 948 2076 1089 863 2255 1353 1442 1837 920 2450 1877 1231 2191 3043 1814 1498 1240 2905 1328 2195 1112 2156 2276 1450 2400 2191 2207 1852 1077 1501 1152 1420 816 1212arrow_forwardI would appreciate someone checking my figures and checking my answers identified in red for accuracy in the attached files. I am a novice in statistics and apprecaite any help I can get.arrow_forward
- race RDG 1 34 1 47 1 42 1 39 1 36 1 50 1 63 1 44 1 47 1 44 1 50 1 44 1 47 1 42 1 42 1 47 1 60 1 39 1 57 1 73 1 47 1 39 1 35 1 39 1 48 1 31 1 52 1 47 1 36 1 47 1 34 1 52 1 42 1 37 1 44 1 71 1 47 1 42 1 42 1 47 1 52 1 52 1 39 1 31 1 60 1 47 1 39 1 42 1 47 1 42 1 36 1 50 1 34 1 55 1 28 1 42 1 44 1 60 1 39 1 36 1 44 1 39 1 39 1 42 1 42 2 52 2 65 2 42 2 47 2 52 2 44 2 52 2 47 2 65 2 63 2 60 2 47 2 65 2 53 2 68 2 55 2 39 2 52 2 65 2 52 2 57 2 63 2 41 2 57 2 36 2 55 2 50 2 63 2 50 2 51 2 47 2 57 2 73 2 52 1 73 1 44 1 57 1 60 1 65 1 57 3 44 3 39 3 55 3 41 3 39 3 63 3 45 3 53 3 31 3 66 3 50 3 44 3 42 3 56 3 38 3 50 3 40 3 71 3 46 3 43 3 68 3 47 3 54 3 39 3 47 3 59 3 63 3 34 3 39 3 39 3 45 3 55 3 36 3 47 3 39 3 36 3…arrow_forwardTable of number of drivers involved in fatal crashes Weather Normal Rain Snow/Sleet Other Unknown 3200 Daylight 14,616 861 227 147 800 Light Condition Dark, but Lighted 5669 469 56 67 258 Dark 8284 695 155 231 564 Dawn/Dusk Other 1249 54 6 80 18 33 79 9 9 148arrow_forwardUse the same scales to construct boxplots for the pulse rates of males and females from the accompanying data sets. Use the boxplots to compare the two data sets. Click the icon to view the data sets. Determine the boxplot for the men's pulse rate data. A. В. 40 50 60 70 80 90 100110 40 50 60 70 80 90 100110 C. D. 40 50 60 70 80 90 100110 40 50 60 70 80 90 100110arrow_forward
- 1 2 3 4 5 6 7 8 9 10 11 12 13 14 15 16 17 18 19 20 21 22 23 24 25 26 27 28 29 30 31 32 33 34 35 36 37 38 Housing Market 1 711000 332500 385000 770000 595000 350000 280000 420000 574000 336000 367500 819000 266000 511000 413000 420000 749000 406000 266000 665000 266000 595000 686000 742000 490000 381500 574000 560000 364000 427000 490000 364000 378000 269500 336000 Scenario: Here you will find a sample of house sale prices from two housing markets. Housing Market 2 374500 462000 586600 665000 180000 124300 525000 745500 476000 451500 315000 179500 521500 693000 724500 287000 346500 122500 864500 392000 756000 308000 420000 560000 476000 798000 346500 238000 371000 367500 420000 980000 260400 301000 176715 Number 1 2 3 Questions Would you rather invest in Market 1 or Market 2? Hypothesis tests would you implement to help you answer this question? Perform these test and report these results. What market would you invest in and why? Answerarrow_forwardDay 1 Day 2 Day 3 Day 4 Day 5 Day 6 Day 7 Day 8 Day 9 Day 10 Nylon 592 505 538 518 555 595 506 579 456 490 Polyester 488 480 405 479 458 436 435 397 453 436 Polypropylene 308 254 295 350 313 317 259 304 360 328 narrow_forwardContinue from the previous question: Two major automobile manufacturers have produced compact cars with engines of the same size. We are interested in determining whether or not there is a significant difference in the mean MPG (miles per gallon) when testing for the fuel efficiency of these two brands of automobiles. The test statistic is 3.465 2.616 3.906 2.096arrow_forward
arrow_back_ios
SEE MORE QUESTIONS
arrow_forward_ios
Recommended textbooks for you
- MATLAB: An Introduction with ApplicationsStatisticsISBN:9781119256830Author:Amos GilatPublisher:John Wiley & Sons Inc
 Probability and Statistics for Engineering and th...StatisticsISBN:9781305251809Author:Jay L. DevorePublisher:Cengage Learning
 Statistics for The Behavioral Sciences (MindTap C...StatisticsISBN:9781305504912Author:Frederick J Gravetter, Larry B. WallnauPublisher:Cengage Learning
  Elementary Statistics: Picturing the World (7th E...StatisticsISBN:9780134683416Author:Ron Larson, Betsy FarberPublisher:PEARSON
 The Basic Practice of StatisticsStatisticsISBN:9781319042578Author:David S. Moore, William I. Notz, Michael A. FlignerPublisher:W. H. Freeman
 Introduction to the Practice of StatisticsStatisticsISBN:9781319013387Author:David S. Moore, George P. McCabe, Bruce A. CraigPublisher:W. H. Freeman
MATLAB: An Introduction with Applications
Statistics
ISBN:9781119256830
Author:Amos Gilat
Publisher:John Wiley & Sons Inc
Probability and Statistics for Engineering and th...
Statistics
ISBN:9781305251809
Author:Jay L. Devore
Publisher:Cengage Learning
Statistics for The Behavioral Sciences (MindTap C...
Statistics
ISBN:9781305504912
Author:Frederick J Gravetter, Larry B. Wallnau
Publisher:Cengage Learning
Elementary Statistics: Picturing the World (7th E...
Statistics
ISBN:9780134683416
Author:Ron Larson, Betsy Farber
Publisher:PEARSON
The Basic Practice of Statistics
Statistics
ISBN:9781319042578
Author:David S. Moore, William I. Notz, Michael A. Fligner
Publisher:W. H. Freeman
Introduction to the Practice of Statistics
Statistics
ISBN:9781319013387
Author:David S. Moore, George P. McCabe, Bruce A. Craig
Publisher:W. H. Freeman