12-1 Explain why the quantity of labor supplied increases with the wage, other things remaining constant (Market Supply of Labor) The following table shows the hours per week supplied to a particular market by three individuals at various wage rates. Calculate the total hours per week (Q,) supplied to the market. 1. Hourly Wage Hours per Week Q, $15 20 16 25 17 35 10 18 45 25 10 19 42 40 30 20 38 37 45 Why does the quantity supplied tend to increase with the hourly wage? Which individuals, if any, have backward- bending supply curves in the wage range shown? Does the market supply curve bend backward in the wage range shown in the table?
12-1 Explain why the quantity of labor supplied increases with the wage, other things remaining constant (Market Supply of Labor) The following table shows the hours per week supplied to a particular market by three individuals at various wage rates. Calculate the total hours per week (Q,) supplied to the market. 1. Hourly Wage Hours per Week Q, $15 20 16 25 17 35 10 18 45 25 10 19 42 40 30 20 38 37 45 Why does the quantity supplied tend to increase with the hourly wage? Which individuals, if any, have backward- bending supply curves in the wage range shown? Does the market supply curve bend backward in the wage range shown in the table?

Principles of Economics 2e
2nd Edition
ISBN:9781947172364
Author:Steven A. Greenlaw; David Shapiro
Publisher:Steven A. Greenlaw; David Shapiro
Chapter14: Labor Markets And Income
Section: Chapter Questions
Problem 3SCQ: Table 14.12 shows the quantity demanded and supplied in the labor market for driving city buses in...

Related questions

Question
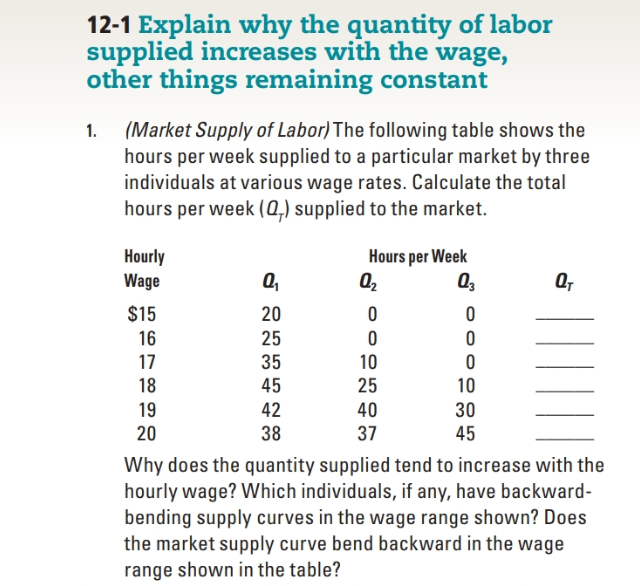
Transcribed Image Text:12-1 Explain why the quantity of labor
supplied increases with the wage,
other things remaining constant
(Market Supply of Labor) The following table shows the
hours per week supplied to a particular market by three
individuals at various wage rates. Calculate the total
hours per week (Q,) supplied to the market.
1.
Hourly
Wage
Hours per Week
Q,
$15
20
16
25
17
35
10
18
45
25
10
19
42
40
30
20
38
37
45
Why does the quantity supplied tend to increase with the
hourly wage? Which individuals, if any, have backward-
bending supply curves in the wage range shown? Does
the market supply curve bend backward in the wage
range shown in the table?
Expert Solution
This question has been solved!
Explore an expertly crafted, step-by-step solution for a thorough understanding of key concepts.

This is a popular solution!

Trending now
This is a popular solution!

Step by step
Solved in 2 steps with 1 images

Knowledge Booster


Learn more about
Need a deep-dive on the concept behind this application? Look no further. Learn more about this topic, economics and related others by exploring similar questions and additional content below.Recommended textbooks for you
Principles of Economics 2e
Economics
ISBN:
9781947172364
Author:
Steven A. Greenlaw; David Shapiro
Publisher:
OpenStax

Principles of Microeconomics
Economics
ISBN:
9781305156050
Author:
N. Gregory Mankiw
Publisher:
Cengage Learning

Principles of Economics, 7th Edition (MindTap Cou…
Economics
ISBN:
9781285165875
Author:
N. Gregory Mankiw
Publisher:
Cengage Learning
Principles of Economics 2e
Economics
ISBN:
9781947172364
Author:
Steven A. Greenlaw; David Shapiro
Publisher:
OpenStax
Principles of Microeconomics
Economics
ISBN:
9781305156050
Author:
N. Gregory Mankiw
Publisher:
Cengage Learning
Principles of Economics, 7th Edition (MindTap Cou…
Economics
ISBN:
9781285165875
Author:
N. Gregory Mankiw
Publisher:
Cengage Learning

Principles of Economics (MindTap Course List)
Economics
ISBN:
9781305585126
Author:
N. Gregory Mankiw
Publisher:
Cengage Learning

Principles of Microeconomics (MindTap Course List)
Economics
ISBN:
9781305971493
Author:
N. Gregory Mankiw
Publisher:
Cengage Learning

Economics (MindTap Course List)
Economics
ISBN:
9781337617383
Author:
Roger A. Arnold
Publisher:
Cengage Learning