6. Plotting the supply of labor In San Diego, 135 people are willing to work an hour as cashiers if the wage is $20 per hour. For each additional $5 that the wage rises above $20, an additional 45 people are willing to work an hour. For wages of $20, $25, $30, $35, and $40 per hour, plot the daily labor supply curve for cashiers on the following graph. 50 45 Supply 40 35 30 25 20 15 10 45 90 135 180 225 270 315 360 405 450 LABOR (Number of workers) What is one explanation for why this labor supply curve is upward sloping? O Labor production functions exhibit diminishing marginal returns. O The opportunity cost of leisure increases as wages increase. O People prefer to spend time doing leisure activities rather than working. O Wages have to increase to accommodate union pressure. WAGE (Dollars per hour)
6. Plotting the supply of labor In San Diego, 135 people are willing to work an hour as cashiers if the wage is $20 per hour. For each additional $5 that the wage rises above $20, an additional 45 people are willing to work an hour. For wages of $20, $25, $30, $35, and $40 per hour, plot the daily labor supply curve for cashiers on the following graph. 50 45 Supply 40 35 30 25 20 15 10 45 90 135 180 225 270 315 360 405 450 LABOR (Number of workers) What is one explanation for why this labor supply curve is upward sloping? O Labor production functions exhibit diminishing marginal returns. O The opportunity cost of leisure increases as wages increase. O People prefer to spend time doing leisure activities rather than working. O Wages have to increase to accommodate union pressure. WAGE (Dollars per hour)

Principles of Microeconomics
7th Edition
ISBN:9781305156050
Author:N. Gregory Mankiw
Publisher:N. Gregory Mankiw
Chapter19: Earnings And Discrimination
Section: Chapter Questions
Problem 3PA

Related questions
Question
Transcribed Image Text:6. Plotting the supply of labor
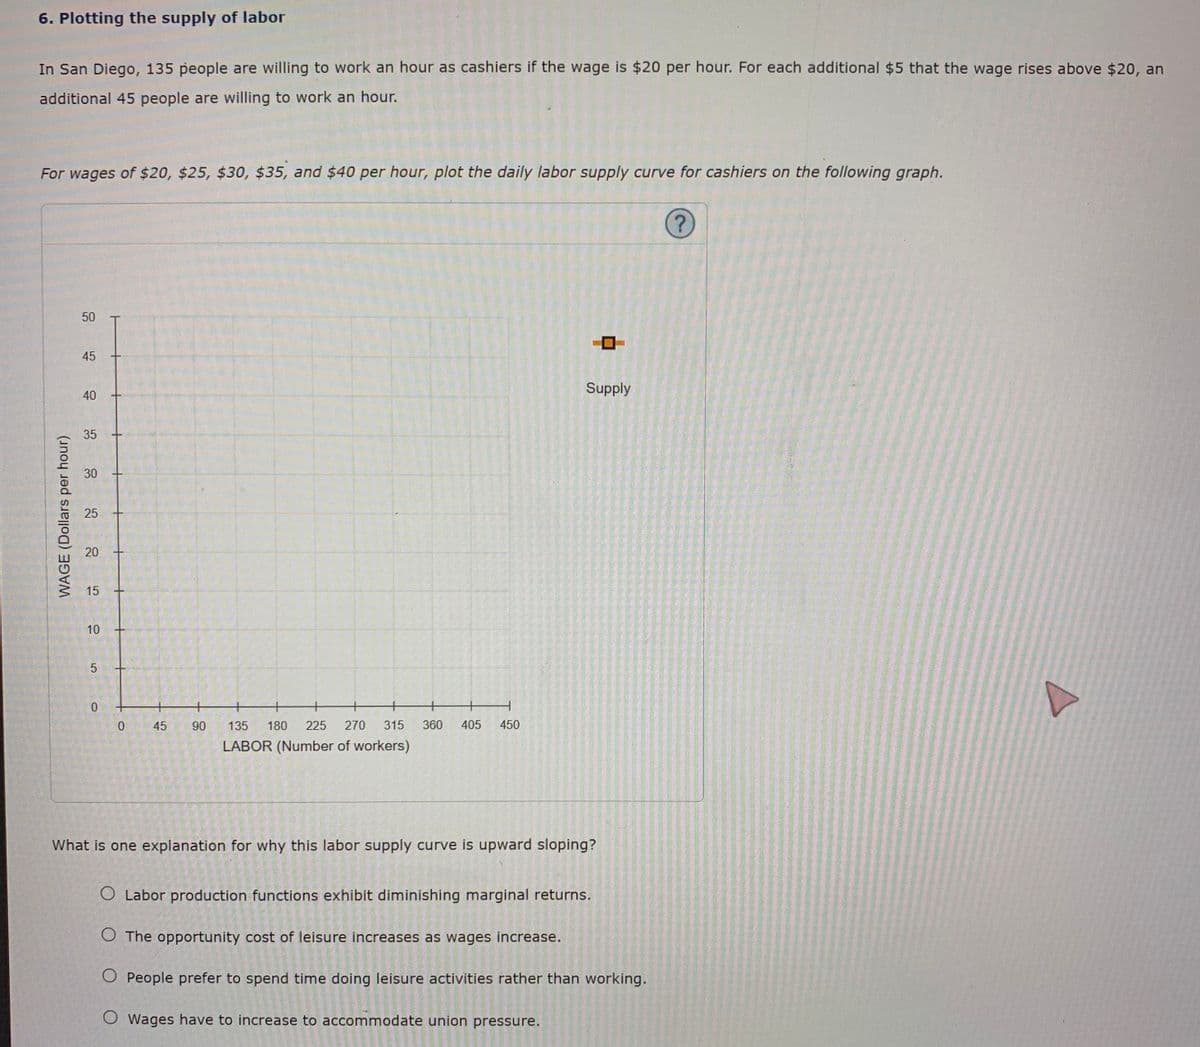
In San Diego, 135 people are willing to work an hour as cashiers if the wage is $20 per hour. For each additional $5 that the wage rises above $20, an
additional 45 people are willing to work an hour.
For wages of $20, $25, $30, $35, and $40 per hour, plot the daily labor supply curve for cashiers on the following graph.
50
45
Supply
40
35
30
20
10
0 45
90
135
180
225
270
315
360
405
450
LABOR (Number of workers)
What is one explanation for why this labor supply curve is upward sloping?
O Labor production functions exhibit diminishing marginal returns.
O The opportunity cost of leisure increases as wages increase.
O People prefer to spend time doing leisure activities rather than working.
O Wages have to increase to accommodate union pressure.
WAGE (Dollars per hour)
15
25
Expert Solution
This question has been solved!
Explore an expertly crafted, step-by-step solution for a thorough understanding of key concepts.

This is a popular solution!

Trending now
This is a popular solution!

Step by step
Solved in 2 steps with 1 images

Recommended textbooks for you
Principles of Microeconomics
Economics
ISBN:
9781305156050
Author:
N. Gregory Mankiw
Publisher:
Cengage Learning


Principles of Macroeconomics (MindTap Course List)
Economics
ISBN:
9781305971509
Author:
N. Gregory Mankiw
Publisher:
Cengage Learning
Principles of Microeconomics
Economics
ISBN:
9781305156050
Author:
N. Gregory Mankiw
Publisher:
Cengage Learning
Principles of Macroeconomics (MindTap Course List)
Economics
ISBN:
9781305971509
Author:
N. Gregory Mankiw
Publisher:
Cengage Learning

Essentials of Economics (MindTap Course List)
Economics
ISBN:
9781337091992
Author:
N. Gregory Mankiw
Publisher:
Cengage Learning

Principles of Economics (MindTap Course List)
Economics
ISBN:
9781305585126
Author:
N. Gregory Mankiw
Publisher:
Cengage Learning

Brief Principles of Macroeconomics (MindTap Cours…
Economics
ISBN:
9781337091985
Author:
N. Gregory Mankiw
Publisher:
Cengage Learning