12. arket equmbrium and The following graph shows the monthly demand and supply curves in the market for shirts. Use the graph input tool to help you answer the following questions. You will not be graded on any changes you make to this graph. Note: Once you enter a value in a white field, the graph and any corresponding amounts in each grey field will change accordingly. Graph Input Tool Market for Shirts 60 54 I Price (Dollars per shirt) Supply 24 48 Quantity Demanded (Shirts) Quantity Supplied (Shirts) 600 400 42 36 30 24 18 Demand 12 100 200 300 400 500 600 700 800 900 1000 QUANTITY (Shirts) The equilibrium price in this market is $ per shirt, and the equilibrium quantity is shirts bought and sold per month. Complete the following table by indicating at each price whether there is a shortage or surplus in the market, the amount of that shortage or surplus, and whether this places upward or downward pressure on prices. Price Shortage or Surplus Amount (Dollars per shirt) Shortage or Surplus (Shirts) Pressure 42 18 PRICE (Dollars per shirt)
12. arket equmbrium and The following graph shows the monthly demand and supply curves in the market for shirts. Use the graph input tool to help you answer the following questions. You will not be graded on any changes you make to this graph. Note: Once you enter a value in a white field, the graph and any corresponding amounts in each grey field will change accordingly. Graph Input Tool Market for Shirts 60 54 I Price (Dollars per shirt) Supply 24 48 Quantity Demanded (Shirts) Quantity Supplied (Shirts) 600 400 42 36 30 24 18 Demand 12 100 200 300 400 500 600 700 800 900 1000 QUANTITY (Shirts) The equilibrium price in this market is $ per shirt, and the equilibrium quantity is shirts bought and sold per month. Complete the following table by indicating at each price whether there is a shortage or surplus in the market, the amount of that shortage or surplus, and whether this places upward or downward pressure on prices. Price Shortage or Surplus Amount (Dollars per shirt) Shortage or Surplus (Shirts) Pressure 42 18 PRICE (Dollars per shirt)

Principles of Economics 2e
2nd Edition
ISBN:9781947172364
Author:Steven A. Greenlaw; David Shapiro
Publisher:Steven A. Greenlaw; David Shapiro
Chapter3: Demand And Supply
Section: Chapter Questions
Problem 55P: Table 3.9 illustrates the markets demand and supply for cheddar cheese. Graph the data and find the...

Related questions
Question
Please do it
Transcribed Image Text:12.
arket equibrium and
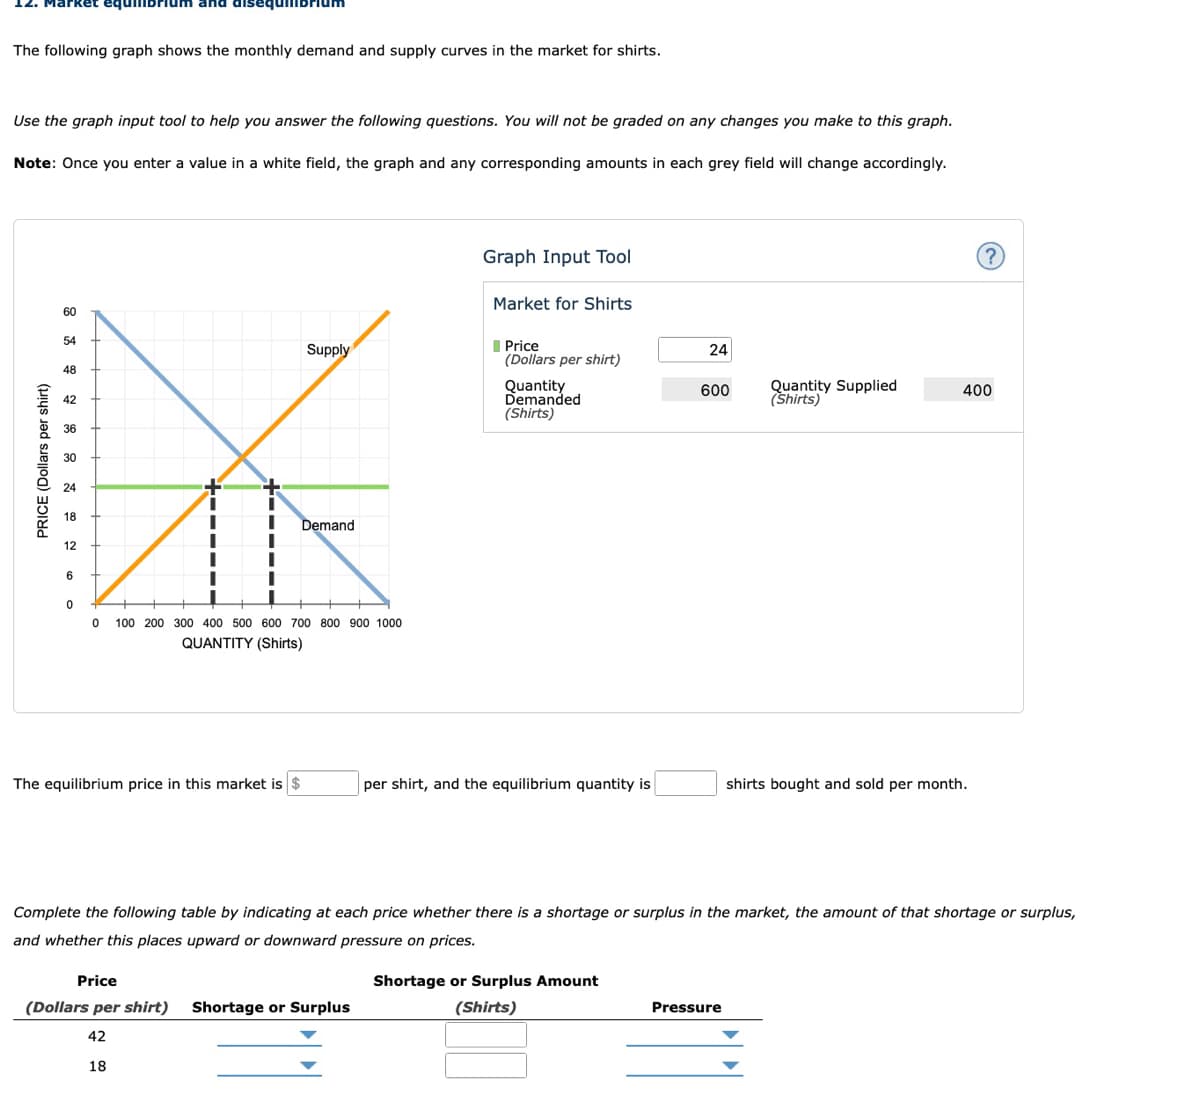
The following graph shows the monthly demand and supply curves in the market for shirts.
Use the graph input tool to help you answer the following questions. You will not be graded on any changes you make to this graph.
Note: Once you enter a value in a white field, the graph and any corresponding amounts in each grey field will change accordingly.
Graph Input Tool
Market for Shirts
60
54
I Price
(Dollars per shirt)
Supply
24
48
Quantity
Demanded
(Shirts)
Quantity Supplied
(Shirts)
600
400
42
36
30
24
18
Demand
12
100 200 300 400 500 600 700 800 900 1000
QUANTITY (Shirts)
The equilibrium price in this market is $
per shirt, and the equilibrium quantity is
shirts bought and sold per month.
Complete the following table by indicating at each price whether there is a shortage or surplus in the market, the amount of that shortage or surplus,
and whether this places upward or downward pressure on prices.
Price
Shortage or Surplus Amount
(Dollars per shirt)
Shortage or Surplus
(Shirts)
Pressure
42
18
PRICE (Dollars per shirt)
Expert Solution
Step 1
In economics, demand refers to the total amount of goods and services which all the consumers in the economy are willing and able to consume at a particular price during a specific period of time whereas the aggregate supply refers to the total quantity of goods and services which all these suppliers are willing to produce and offer for sale at a given price during a specific period of time. The aggregate demand and aggregate supply in the economy is represented by the demand curve and supply curve respectively. The point where both of these intersect is known as the equilibrium point.

Trending now
This is a popular solution!

Step by step
Solved in 3 steps

Knowledge Booster


Learn more about
Need a deep-dive on the concept behind this application? Look no further. Learn more about this topic, economics and related others by exploring similar questions and additional content below.Recommended textbooks for you
Principles of Economics 2e
Economics
ISBN:
9781947172364
Author:
Steven A. Greenlaw; David Shapiro
Publisher:
OpenStax

Economics Today and Tomorrow, Student Edition
Economics
ISBN:
9780078747663
Author:
McGraw-Hill
Publisher:
Glencoe/McGraw-Hill School Pub Co

Essentials of Economics (MindTap Course List)
Economics
ISBN:
9781337091992
Author:
N. Gregory Mankiw
Publisher:
Cengage Learning
Principles of Economics 2e
Economics
ISBN:
9781947172364
Author:
Steven A. Greenlaw; David Shapiro
Publisher:
OpenStax
Economics Today and Tomorrow, Student Edition
Economics
ISBN:
9780078747663
Author:
McGraw-Hill
Publisher:
Glencoe/McGraw-Hill School Pub Co
Essentials of Economics (MindTap Course List)
Economics
ISBN:
9781337091992
Author:
N. Gregory Mankiw
Publisher:
Cengage Learning

Brief Principles of Macroeconomics (MindTap Cours…
Economics
ISBN:
9781337091985
Author:
N. Gregory Mankiw
Publisher:
Cengage Learning

