5. Supply: Bansic concepts Complete the following table by selecting the term that matches each definition. Quantity Supplied Definition Supply Supply Schedule Law of Curve Supply A graphical object showing the relationship between the price of a good and the amount that sellers are willing and able to supply at various prices A table showing the relationship between the price of a good and the amount of it that sellers are willing and able to supply at various prices The claim that, other things being equal, the quantity supplied of a good increases when the price of that good rises The amount of a good that sellers are willing and able to supply at a given price Apply your understanding of the previous key terms by completing the following scenario with the appropriate terminology. Your boss would like your help on a marketing research project he is conducting on the relationship between the price of juice and the quantity of juice supplied. He hands you the following document: Quantity of Juice Supplied (Billions of cans) Price of Juice (Dollars per can) 0.50 0.75 quantity of juice supplied 1.00 supply curve 1.25 law of supply supply schedule and construct a graphical representation of the data. In doing so, you determine that as the Your task is to take this supply schedule The quantity of juice supplied increases. This confirms the
5. Supply: Bansic concepts Complete the following table by selecting the term that matches each definition. Quantity Supplied Definition Supply Supply Schedule Law of Curve Supply A graphical object showing the relationship between the price of a good and the amount that sellers are willing and able to supply at various prices A table showing the relationship between the price of a good and the amount of it that sellers are willing and able to supply at various prices The claim that, other things being equal, the quantity supplied of a good increases when the price of that good rises The amount of a good that sellers are willing and able to supply at a given price Apply your understanding of the previous key terms by completing the following scenario with the appropriate terminology. Your boss would like your help on a marketing research project he is conducting on the relationship between the price of juice and the quantity of juice supplied. He hands you the following document: Quantity of Juice Supplied (Billions of cans) Price of Juice (Dollars per can) 0.50 0.75 quantity of juice supplied 1.00 supply curve 1.25 law of supply supply schedule and construct a graphical representation of the data. In doing so, you determine that as the Your task is to take this supply schedule The quantity of juice supplied increases. This confirms the

Chapter4: Supply And Demand: An Initial Look
Section: Chapter Questions
Problem 3TY

Related questions
Question
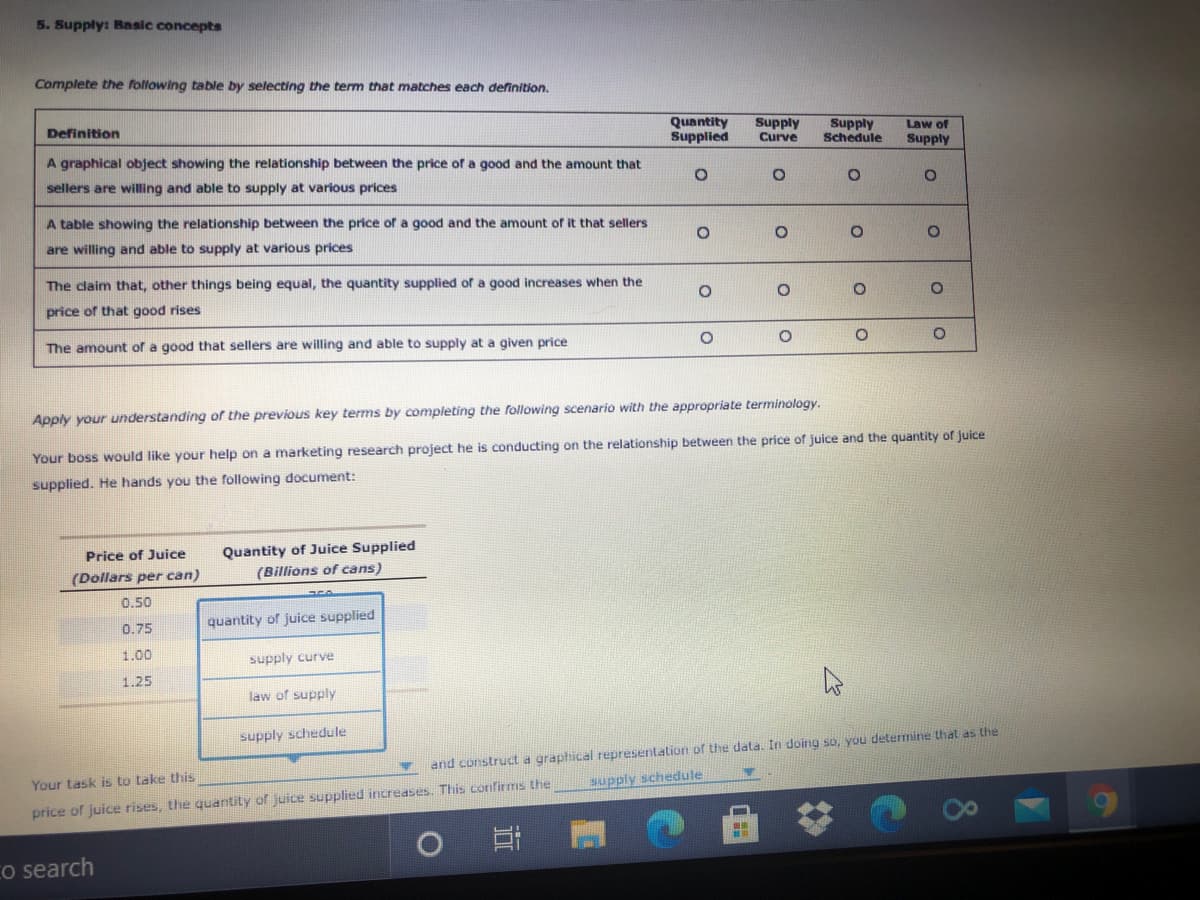
Transcribed Image Text:5. Supply: Bansic concepts
Complete the following table by selecting the term that matches each definition.
Quantity
Supplied
Definition
Supply
Supply
Schedule
Law of
Curve
Supply
A graphical object showing the relationship between the price of a good and the amount that
sellers are willing and able to supply at various prices
A table showing the relationship between the price of a good and the amount of it that sellers
are willing and able to supply at various prices
The claim that, other things being equal, the quantity supplied of a good increases when the
price of that good rises
The amount of a good that sellers are willing and able to supply at a given price
Apply your understanding of the previous key terms by completing the following scenario with the appropriate terminology.
Your boss would like your help on a marketing research project he is conducting on the relationship between the price of juice and the quantity of juice
supplied. He hands you the following document:
Quantity of Juice Supplied
(Billions of cans)
Price of Juice
(Dollars per can)
0.50
0.75
quantity of juice supplied
1.00
supply curve
1.25
law of supply
supply schedule
and construct a graphical representation of the data. In doing so, you determine that as the
Your task is to take this
supply schedule
The quantity of juice supplied increases. This confirms the
Expert Solution
This question has been solved!
Explore an expertly crafted, step-by-step solution for a thorough understanding of key concepts.

This is a popular solution!

Trending now
This is a popular solution!

Step by step
Solved in 2 steps with 1 images

Knowledge Booster


Learn more about
Need a deep-dive on the concept behind this application? Look no further. Learn more about this topic, economics and related others by exploring similar questions and additional content below.Recommended textbooks for you

Essentials of Economics (MindTap Course List)
Economics
ISBN:
9781337091992
Author:
N. Gregory Mankiw
Publisher:
Cengage Learning

Brief Principles of Macroeconomics (MindTap Cours…
Economics
ISBN:
9781337091985
Author:
N. Gregory Mankiw
Publisher:
Cengage Learning
Essentials of Economics (MindTap Course List)
Economics
ISBN:
9781337091992
Author:
N. Gregory Mankiw
Publisher:
Cengage Learning
Brief Principles of Macroeconomics (MindTap Cours…
Economics
ISBN:
9781337091985
Author:
N. Gregory Mankiw
Publisher:
Cengage Learning

Principles of Economics 2e
Economics
ISBN:
9781947172364
Author:
Steven A. Greenlaw; David Shapiro
Publisher:
OpenStax

Exploring Economics
Economics
ISBN:
9781544336329
Author:
Robert L. Sexton
Publisher:
SAGE Publications, Inc
