13 Match each of the QPCR samples (i-v) with the correct amplification plot (A-E) and determine the Ct value for each of the amplification curves. Number of template copies in the QPCR reaction: Amplification plot (A-E): Ct Value 1200 1000 i. 1X 10⁶ ii. 1X 10⁵ iii. 1X 10⁸ iv. 1X 10⁷ V. NTC (No template control) 800 600 400 200 A C 0 5 10 15 20 25 30 Cycles vi. Create a standard curve graph of template copies vs Ct with the data in the table above. Log of Starting Quantity of DNA vrs C+ vii. 26 24 22221 20 18 16 14 12 כי 10 8 6 4 2 0 5 5.5 6 6.5 7 7.5 8 Log Starting Quantity of DNA (Template copies) If a patient sample has a Ct of 20, interpolate the number of template copies at the start of the PCR reaction using the standard curve you created above?
13 Match each of the QPCR samples (i-v) with the correct amplification plot (A-E) and determine the Ct value for each of the amplification curves. Number of template copies in the QPCR reaction: Amplification plot (A-E): Ct Value 1200 1000 i. 1X 10⁶ ii. 1X 10⁵ iii. 1X 10⁸ iv. 1X 10⁷ V. NTC (No template control) 800 600 400 200 A C 0 5 10 15 20 25 30 Cycles vi. Create a standard curve graph of template copies vs Ct with the data in the table above. Log of Starting Quantity of DNA vrs C+ vii. 26 24 22221 20 18 16 14 12 כי 10 8 6 4 2 0 5 5.5 6 6.5 7 7.5 8 Log Starting Quantity of DNA (Template copies) If a patient sample has a Ct of 20, interpolate the number of template copies at the start of the PCR reaction using the standard curve you created above?

Biology: The Dynamic Science (MindTap Course List)
4th Edition
ISBN:9781305389892
Author:Peter J. Russell, Paul E. Hertz, Beverly McMillan
Publisher:Peter J. Russell, Paul E. Hertz, Beverly McMillan
Chapter14: Dna Structure And Replication
Section: Chapter Questions
Problem 16TYK

Related questions
Question
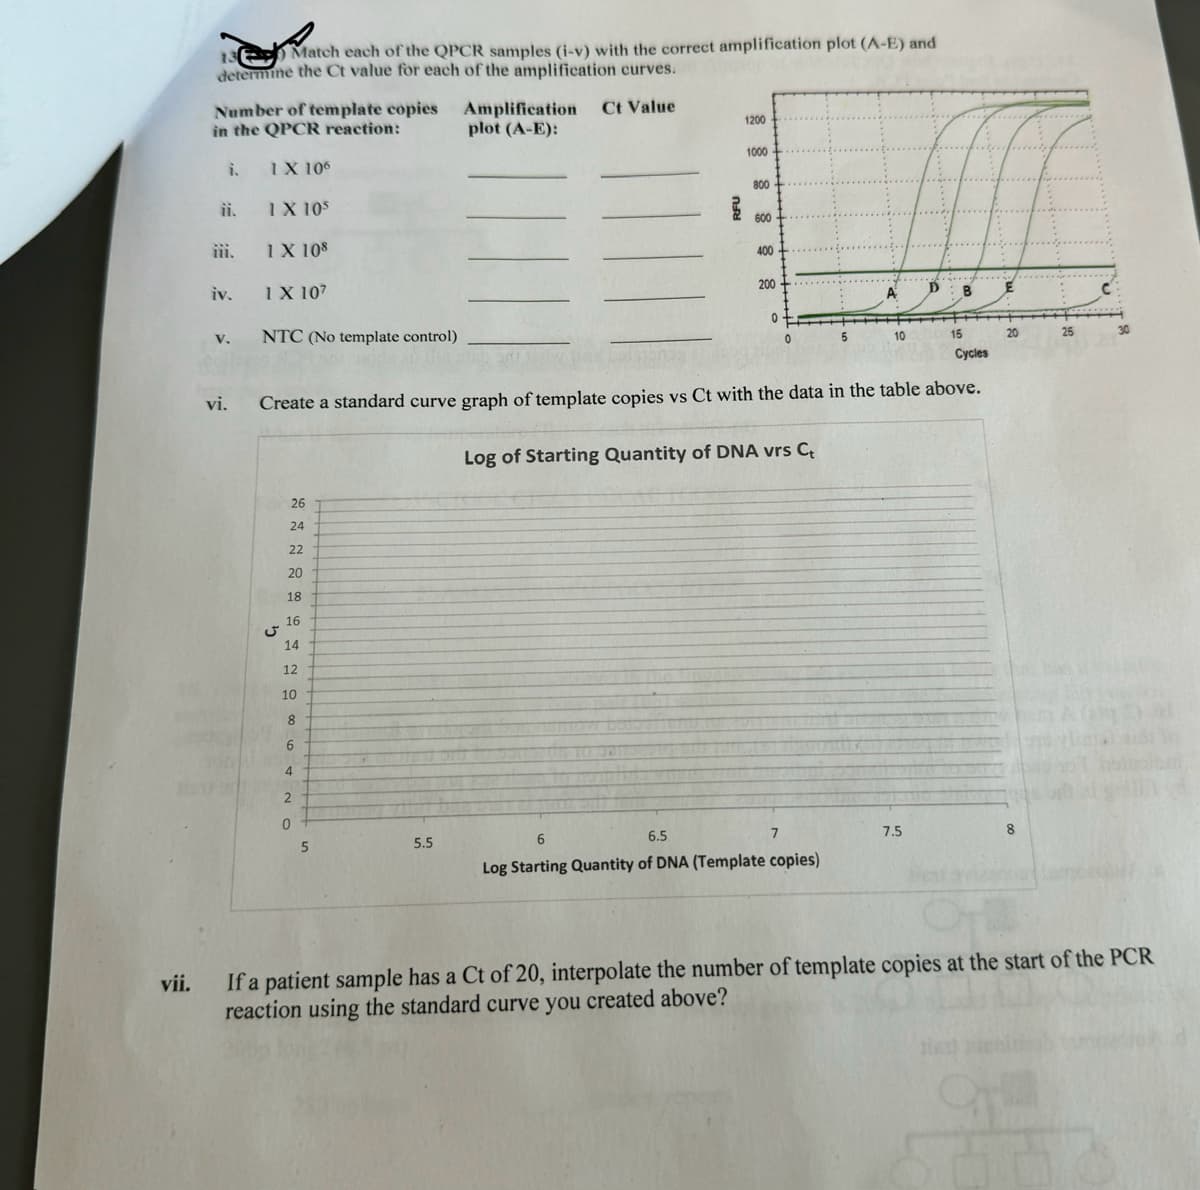
Transcribed Image Text:13 Match each of the QPCR samples (i-v) with the correct amplification plot (A-E) and
determine the Ct value for each of the amplification curves.
Number of template copies
in the QPCR reaction:
Amplification
plot (A-E):
Ct Value
1200
1000
i.
1X 10⁶
ii. 1X 10⁵
iii. 1X 10⁸
iv. 1X 10⁷
V.
NTC (No template control)
800
600
400
200
A
C
0
5
10
15
20
25
30
Cycles
vi. Create a standard curve graph of template copies vs Ct with the data in the table above.
Log of Starting Quantity of DNA vrs C+
vii.
26
24
22221
20
18
16
14
12
כי
10
8
6
4
2
0
5
5.5
6
6.5
7
7.5
8
Log Starting Quantity of DNA (Template copies)
If a patient sample has a Ct of 20, interpolate the number of template copies at the start of the PCR
reaction using the standard curve you created above?
Expert Solution
This question has been solved!
Explore an expertly crafted, step-by-step solution for a thorough understanding of key concepts.

Step by step
Solved in 2 steps

Recommended textbooks for you
Biology: The Dynamic Science (MindTap Course List)
Biology
ISBN:
9781305389892
Author:
Peter J. Russell, Paul E. Hertz, Beverly McMillan
Publisher:
Cengage Learning


Biology (MindTap Course List)
Biology
ISBN:
9781337392938
Author:
Eldra Solomon, Charles Martin, Diana W. Martin, Linda R. Berg
Publisher:
Cengage Learning
Biology: The Dynamic Science (MindTap Course List)
Biology
ISBN:
9781305389892
Author:
Peter J. Russell, Paul E. Hertz, Beverly McMillan
Publisher:
Cengage Learning
Biology (MindTap Course List)
Biology
ISBN:
9781337392938
Author:
Eldra Solomon, Charles Martin, Diana W. Martin, Linda R. Berg
Publisher:
Cengage Learning

Biology: The Unity and Diversity of Life (MindTap…
Biology
ISBN:
9781337408332
Author:
Cecie Starr, Ralph Taggart, Christine Evers, Lisa Starr
Publisher:
Cengage Learning