13. Based from the survey conducted, find the frequency of the class 30 - 40: Marks More than or equal to 10 More than or equal to 20 More than or equal to 40 48 58 55 Obtained No. of students 51 a. b 3 c. 4 d. 48 14. The weekly salaries (in dollars) of 24 randomly selected employees of a company are shown below. Construct a boxplot for the data set: (310, 320, 450, 460, 470, 500, 520, 540, 580, 600, 650, 700, 710, 840, 870, 900, 1000, 1200, 1250, 1300, 1400, 1720, 2500, 3700). Construct a boxplot for the given data. a. 500 C. 600 b. 310 700 C. $10 a. More than or equal to 0 63 310 705 1200 1225 3700 3700 d. More than or equal to 30 51 C. 310 310 500 510 705 15. This is a statistical method wherein statistical efforts deal with the samples. Descriptive statistics Basic statistics b. Inferential statistics 1200 3700 2225 3700 d. Deductive statistics More than or equal to 50 42 16. Which of the following statements best describes the relationship between a parameter and a statistic? a. A parameter has a sampling distribution that can be used to determine what values the statistic is likely to have in repeated samples. b. A statistic is used to estimate a parameter. h A parameter is used to estimate a statistic. d. A parameter has a sampling distribution with the statistic as its mean.
13. Based from the survey conducted, find the frequency of the class 30 - 40: Marks More than or equal to 10 More than or equal to 20 More than or equal to 40 48 58 55 Obtained No. of students 51 a. b 3 c. 4 d. 48 14. The weekly salaries (in dollars) of 24 randomly selected employees of a company are shown below. Construct a boxplot for the data set: (310, 320, 450, 460, 470, 500, 520, 540, 580, 600, 650, 700, 710, 840, 870, 900, 1000, 1200, 1250, 1300, 1400, 1720, 2500, 3700). Construct a boxplot for the given data. a. 500 C. 600 b. 310 700 C. $10 a. More than or equal to 0 63 310 705 1200 1225 3700 3700 d. More than or equal to 30 51 C. 310 310 500 510 705 15. This is a statistical method wherein statistical efforts deal with the samples. Descriptive statistics Basic statistics b. Inferential statistics 1200 3700 2225 3700 d. Deductive statistics More than or equal to 50 42 16. Which of the following statements best describes the relationship between a parameter and a statistic? a. A parameter has a sampling distribution that can be used to determine what values the statistic is likely to have in repeated samples. b. A statistic is used to estimate a parameter. h A parameter is used to estimate a statistic. d. A parameter has a sampling distribution with the statistic as its mean.

MATLAB: An Introduction with Applications
6th Edition
ISBN:9781119256830
Author:Amos Gilat
Publisher:Amos Gilat
Chapter1: Starting With Matlab
Section: Chapter Questions
Problem 1P

Related questions
Question
Answer the following questions in the picture below. Only the correct letter.
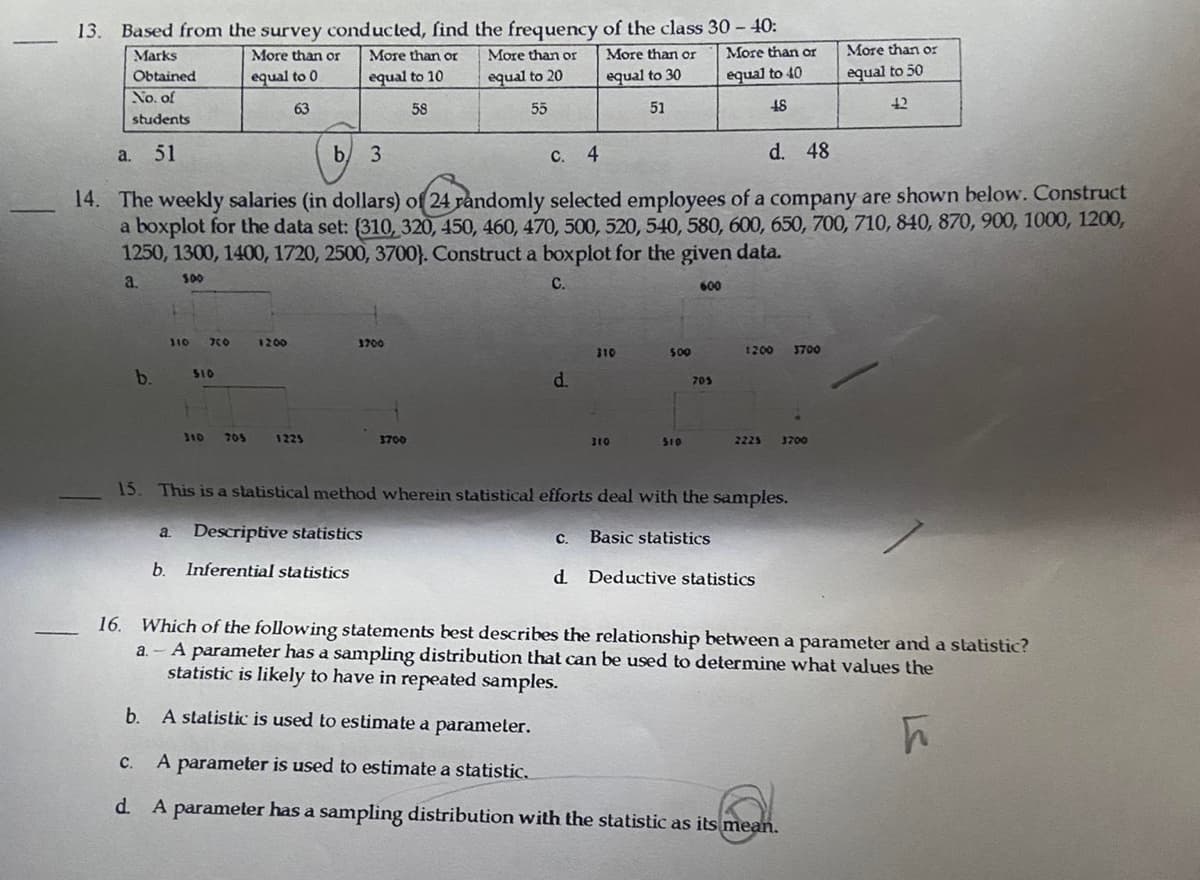
Transcribed Image Text:13. Based from the survey conducted, find the frequency of the class 30 - 40:
Marks
Obtained
No. of
students
More than or
equal to 40
48
51
a.
b.
310 700
SID
More than or
equal to 0
b. 3
C. 4
d. 48
14. The weekly salaries (in dollars) of 24 randomly selected employees of a company are shown below. Construct
a boxplot for the data set: (310, 320, 450, 460, 470, 500, 520, 540, 580, 600, 650, 700, 710, 840, 870, 900, 1000, 1200,
1250, 1300, 1400, 1720, 2500, 3700). Construct a boxplot for the given data.
a.
500
C.
600
310 705
a.
63
1200
1225
More than or
equal to 10
58
3700
Descriptive statistics
b. Inferential statistics
More than or
equal to 20
55
3700
d.
More than or
equal to 30
51
C.
310
310
500
510
705
15. This is a statistical method wherein statistical efforts deal with the samples.
Basic statistics
1200 3700
2225 3700
More than or
equal to 50
42
d. Deductive statistics
16. Which of the following statements best describes the relationship between a parameter and a statistic?
a.- A parameter has a sampling distribution that can be used to determine what values the
statistic is likely to have in repeated samples.
b. A statistic is used to estimate a parameter.
h
C.
A parameter is used to estimate a statistic.
d. A parameter has a sampling distribution with the statistic as its mean.
Expert Solution
This question has been solved!
Explore an expertly crafted, step-by-step solution for a thorough understanding of key concepts.

This is a popular solution!

Trending now
This is a popular solution!

Step by step
Solved in 2 steps

Recommended textbooks for you
MATLAB: An Introduction with Applications
Statistics
ISBN:
9781119256830
Author:
Amos Gilat
Publisher:
John Wiley & Sons Inc

Probability and Statistics for Engineering and th…
Statistics
ISBN:
9781305251809
Author:
Jay L. Devore
Publisher:
Cengage Learning

Statistics for The Behavioral Sciences (MindTap C…
Statistics
ISBN:
9781305504912
Author:
Frederick J Gravetter, Larry B. Wallnau
Publisher:
Cengage Learning
MATLAB: An Introduction with Applications
Statistics
ISBN:
9781119256830
Author:
Amos Gilat
Publisher:
John Wiley & Sons Inc
Probability and Statistics for Engineering and th…
Statistics
ISBN:
9781305251809
Author:
Jay L. Devore
Publisher:
Cengage Learning
Statistics for The Behavioral Sciences (MindTap C…
Statistics
ISBN:
9781305504912
Author:
Frederick J Gravetter, Larry B. Wallnau
Publisher:
Cengage Learning

Elementary Statistics: Picturing the World (7th E…
Statistics
ISBN:
9780134683416
Author:
Ron Larson, Betsy Farber
Publisher:
PEARSON

The Basic Practice of Statistics
Statistics
ISBN:
9781319042578
Author:
David S. Moore, William I. Notz, Michael A. Fligner
Publisher:
W. H. Freeman

Introduction to the Practice of Statistics
Statistics
ISBN:
9781319013387
Author:
David S. Moore, George P. McCabe, Bruce A. Craig
Publisher:
W. H. Freeman