13. What is an approximate 95% confidence interval for , the coefficient of the variable S Per Pupil? A)0.00639 0.0025 B) 0.00639 0.0042 0.00639 0.0050 C) D) 0.00639 + 0.0067
13. What is an approximate 95% confidence interval for , the coefficient of the variable S Per Pupil? A)0.00639 0.0025 B) 0.00639 0.0042 0.00639 0.0050 C) D) 0.00639 + 0.0067

Glencoe Algebra 1, Student Edition, 9780079039897, 0079039898, 2018
18th Edition
ISBN:9780079039897
Author:Carter
Publisher:Carter
Chapter10: Statistics
Section10.6: Summarizing Categorical Data
Problem 10CYU

Related questions

Topic Video
Question
Hi I know that you can’t answer every question is there anyway you can just answer question 13 please?
Transcribed Image Text:3:04
Back
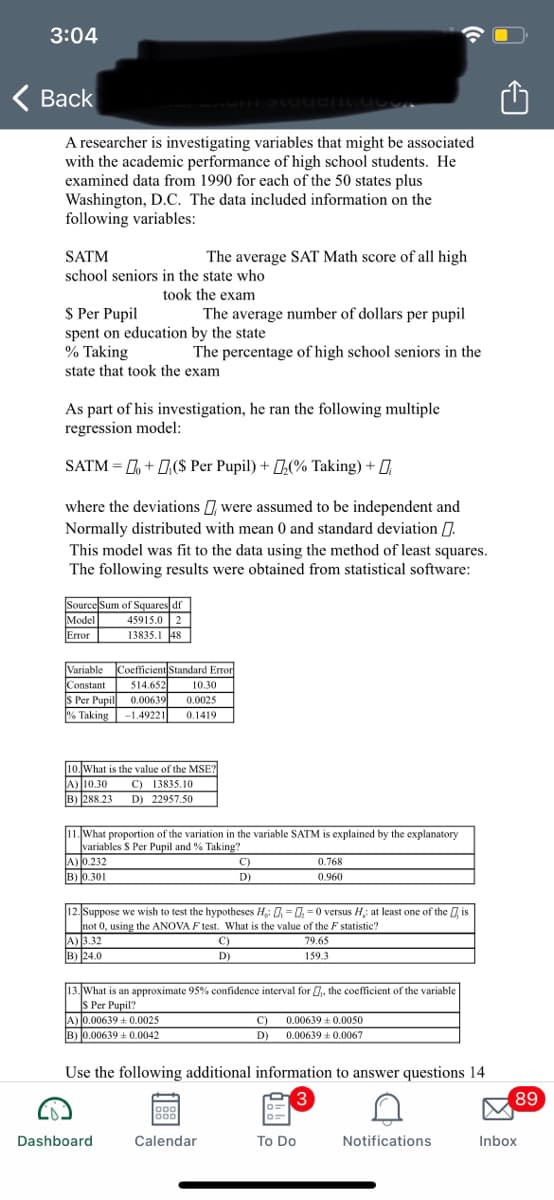
A researcher is investigating variables that might be associated
with the academic performance of high school students. He
examined data from 1990 for each of the 50 states plus
Washington, D.C. The data included information on the
following variables:
SATM
The average SAT Math score of all high
school seniors in the state who
took the exam
The average number of dollars per pupil
S Per Pupil
spent on education by the state
% Taking
The percentage of high school seniors in the
state that took the exam
As part of his investigation, he ran the following multiple
regression model:
SATM = L + 0,($ Per Pupil) + (% Taking) + D
where the deviations were assumed to be independent and
Normally distributed with mean 0 and standard deviation .
This model was fit to the data using the method of least squares.
The following results were obtained from statistical software:
Source Sum of Squares df
Model
Error
45915.0 2
13835.1 48
Variable
Coefficient Standard Erron
Constant
514.652
10.30
S Per Pupil
% Taking
0.00639
-1.49221
0.0025
0.1419
10. What is the value of the MSET
A) 10.30
B) 288.23
C) 13835.10
D) 22957.50
11. What proportion of the variation in the variable SATM is explained by the explanatory
variables S Per Pupil and % Taking?
A) 0.232
B) 0.301
C)
0.768
D)
0.960
12. Suppose we wish to test the hypotheses H,: 0, = 0, =0 versus H: at least one of the is
not 0, using the ANOVA F test. What is the value of the F statistic?
A) 3.32
B) 24.0
C)
79.65
D)
159.3
13. What is an approximate 95% confidence interval for 0, the coefficient of the variable
S Per Pupil?
A) 0.00639 + 0.0025
B) 0.00639 + 0.0042
C)
0.00639 +0.0050
D)
0.00639 +0.0067
Use the following additional information to answer questions 14
3
89
o00
o00
Dashboard
Calendar
To Do
Notifications
Inbox
Expert Solution
This question has been solved!
Explore an expertly crafted, step-by-step solution for a thorough understanding of key concepts.

Step by step
Solved in 3 steps

Knowledge Booster


Learn more about
Need a deep-dive on the concept behind this application? Look no further. Learn more about this topic, statistics and related others by exploring similar questions and additional content below.Recommended textbooks for you
Glencoe Algebra 1, Student Edition, 9780079039897…
Algebra
ISBN:
9780079039897
Author:
Carter
Publisher:
McGraw Hill

Big Ideas Math A Bridge To Success Algebra 1: Stu…
Algebra
ISBN:
9781680331141
Author:
HOUGHTON MIFFLIN HARCOURT
Publisher:
Houghton Mifflin Harcourt
Glencoe Algebra 1, Student Edition, 9780079039897…
Algebra
ISBN:
9780079039897
Author:
Carter
Publisher:
McGraw Hill
Big Ideas Math A Bridge To Success Algebra 1: Stu…
Algebra
ISBN:
9781680331141
Author:
HOUGHTON MIFFLIN HARCOURT
Publisher:
Houghton Mifflin Harcourt