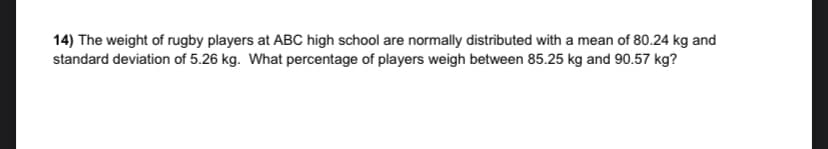
14) The weight of rugby players at ABC high school are normally distributed with a mean of 80.24 kg and standard deviation of 5.26 kg. What percentage of players weigh between 85.25 kg and 90.57 kg?
Q: Use the two histograms below to compare the weights of regular cola and diet cola Diet Cola 0.7800…
A: In the histogram of diet cola the range of weights is from 0.7750 to .7950. The same for the regular…
Q: The data table to the right represents the volumes of a generic soda brand. Complete parts (a) and…
A: Given volume of sode(oz) is75,70,70,70,50,70,65,70,75,85,75,65,80,80sample size(n)=14
Q: (a) P(An B) (b) P(A¹) (c) P(AUB)
A: Since you have posted a question with multiple sub-parts, we will solve first three subparts for…
Q: 2. The breakdown time (in minutes) of an insulating fluid between electrodes at 34 kV are reported…
A: Given data: 0.19 0.78 0.96 1.31 2.78 3.16 4.15 4.67 4.85 6.50 7.35 8.01 8.27 12.06 25.75 32.52…
Q: In a chemical plant, 24 holding tanks are used for final product storage. Four tanks are selected at…
A: Total tanks =24 7 contains high-viscosity 4 out of 24 selected randomly We have to calculate…
Q: An emergency room tracked admissions over a 48-hour period. The following table summarizes…
A: From the provided information, COVID COVID SEVERITY Yes No Total Mild…
Q: The contingency table below summarizes a survey of 1,000 bottled beverage consumers. P(Recycles)…
A: Solution To find the probabilities we will use conditional probability rule.
Q: The coordinate -6 has a weight of 3, and the coordinate 2 has a weight of 1.
A: From the provided information, The coordinate -6 (x1) has a weight of 3 that is w1 = 3 And…
Q: Click the icon to view the data sets. Determine the boxplot for the men's pulse rate data. Choose…
A: The objective is to construct boxplots for the given data and identify the outliers:
Q: You wish to test the following claim (Ha) at a significance level of a = 0.002. Ho: P₁ = P2 Ha: P₁…
A: given data α = 0.002H0 : p1 = p2Ha : p1 > p2n1 = 799, p^1 = 0.369n2 = 465, p^2 = 0.353
Q: OBSERVATIONS 1 2 3 4 5 6 7 8 9 10 QUANTITY 28 69 42 32 42 72 66 49 70 60 PRICE 250 400 450 550 575…
A: Given data: Observations Quantity Price Advertising Distance 1 28 250 11 12 2 69 400 24 6 3…
Q: Consider the following probability distribution: X P(X) 1 0.1 2 ? 3 0.2 4 0.3 What is the mean…
A:
Q: Want to explain these outputs?
A: The variation between and within the number of groups are explained using ANOVA. It also explain the…
Q: What is the test statistic for this sample? (Report answer accurate to three decimal places.) test…
A: Given: α=0.002 Sample proportion, p^1=0.369 Sample size, n1 is 799 Sample proportion, p^2=0.353…
Q: This is rejecting Ho when it is true. If the alternative hypothesis says not equal to we know are…
A: We have to match the given definitions with the given terms.
Q: Suppose that a study of elementary school students reports that the mean age at which children begin…
A: GivenMean(μ)=5.7standard deviation(σ)=1.2sample size(n)=60
Q: You may need to use the appropriate appendix table to answer this question. According to Money…
A:
Q: Ho:p1=p2 Ha:p1≠p2 You obtain 94% successes in a sample of size n1=796n1=796 from the first…
A: Given: n1=796p1=0.94n2=329p2=0.979α=0.001
Q: Find the standard deviation, s, of sample data summarized in the frequency distribution table below…
A: Given standard deviation formula, we should find standard deviation of the given frequency…
Q: Suppose a sample of 9 customers spends an average of $200 with a standard deviation $20 what is a…
A: Solution: Given that, Mean x̄ = 200 Sample size n = 9 Standard deviation s = 20
Q: The object of a general chemistry experiment is to determine the amount (in millilitres [mL]) of…
A: The sampled volume of NaOH (in mL) required to attain the specified pH level is given as: 82.20,…
Q: Here is a bivariate data set. X 51.3 11.7 43.8 -2.9 173.8 27.7 109.3 50.9 40.6 y 19.3 115.1 41.8…
A: The bivariate data set contains x and y variables with 13 observations.
Q: (a) It has been reported that the length of human pregnancies from conception to birth…
A: a)GivenMean(μ)=266standard deviation(σ)=16
Q: 11. Pearson's coefficient of Skewness for a distribution is 0.4 and its coefficient of variation is…
A:
Q: The following data show, in convenient units, the yield Y of a chemical reaction run at various…
A:
Q: Use the confidence level and sample data to find a confidence interval for estimating the population…
A: Given that n = 105 , Xbar = 441 , s = 40 90% confidence interval
Q: Using the standard normal distribution, find the two z-scores that that form the middle shaded…
A:
Q: 2 X² test for goodness of fit Show that - 2log 2
A: Hint: First find the expected Frequencies for 6 faces. Then, apply the chi-square test of goodness…
Q: -way ANOVA where there are k treatments and n observations, egrees of freedom for the F-statistic…
A: Given that K treatment and n observations.
Q: mployees must complete new machine set ups within 30 New machine set-up times can be described by a…
A: Given: Population mean μ=22 Population standard deviation σ=4 Let X ~ N(22, 42)
Q: machine consists of two components: A and B. The machine needs both components to operate. As soon…
A: Given problem is:
Q: Want to explain these outputs?
A: Anova is the measure of mean significance. It compare three or more groups. It explain the variation…
Q: You are conducting a test of independence for the claim that there is an association between the row…
A:
Q: Measures of central tendency alone are insufficient to completely describe a sample because:
A: Hint: Central value for two samples can be same.
Q: A new machine has just been installed to produce printed circuit boards. One of the critical…
A: Given data: Time 1 2 3 4 5 8:00 87.1 87.5 88.1 87.2 87.0 8:30 86.9 88.5 87.6 87.5 87.4 9:00…
Q: Obesity as % of the adult population 20 30
A: Research explaining the recent credit bubble by obesity. The two variables are Obese Adults as a %…
Q: Twenty percent of anthropology majors were offered a starting salary greater than .
A: Given that Mean = M = 39269 Standard deviation = SD =2550 X ~ Normal ( M = 39269 , SD = 2550 )
Q: A survey is conducted and the number of people in each household and the amount spent on groceries…
A: In this case the variables of interest are "number of people in household" and "amount spent on…
Q: stions to be answered while studying new material had better scores when tested on the material…
A: Given: Sample mean x¯=78.30 Sample size (n) = 16 Sample standard deviation (s) = 8.40 Population…
Q: (c) Given that the duration taken to run a converged simulation is normally distributed with an…
A: given data normal distribution μ = 120σ = 15
Q: R5.21. Teach for America Several programs attempt to address the shortage of qualified teachers by…
A: Given: x¯1=35.62s1=9.31x¯2=32.48s1=9.43n1=n2=44 Degrees of freedom(df): df=86 X follows two sample…
Q: he data represents the heights of eruptions by a geyser. Ise the heights to construct a stemplot.…
A: For the given data The values closest in the middle are ? inches and ? inches
Q: The following data are the percentages of alcohol in five randomly selected brands of beer. Find the…
A: Given: Sample size n = 5 Formula Used: Population standard deviation σ = ∑i=1n(Xi-X)2n Where X is a…
Q: Want to explain these outputs?
A: Normality of the test is used to determine the population follow normal distribution or not. It can…
Q: Below 99 Calculate standard deviation (beg summation method) from the following data: Marks No. of…
A:
Q: Two samples are taken with the following sample means, sizes, and standard deviations ¯x1 = 29 ¯x2 =…
A: The sample size for first sample is 65, sample mean is 29 and sample standard deviation is 5. The…
Q: Class: Frequency: Calculate the median of the following frequency distribution: 30-40 40-50 10 16…
A: Solution: Class Frequency (f) cf 20 - 30 6 6 30 - 40 10 16 40 - 50 16 32 = cf (L = 50) -…
Q: Use the given data to find teh minimum sample size required to estimate the population proportion.…
A: Here we will Use the given data to find the minimum sample size required to estimate the population…
Q: A doctor's office staff studied the waiting times for over a one-month period. Use classes of 0-4,…
A: Given that,
Q: Which of the following is not a requirement for the binomial/bernouilli probability distribution?
A: Bernouilli distribution is a special case of binomial distribution with a single trial.
Step by step
Solved in 2 steps