Here is a bivariate data set. X 51.3 11.7 43.8 -2.9 173.8 27.7 109.3 50.9 40.6 y 19.3 115.1 41.8 63.7 76.9 40.1 46.2 41.6 63.2 26.4 43.5 32.3 66.8 51.6 14.9 36.9 42.9 This data can be downloaded as a *.csv file with this link: Download CSV Find the correlation coefficient and report it accurate to three decimal places. r= 0.110 x What proportion of the variation in y can be explained by the variation in the values of x? Report answer as a percentage accurate to one decimal place. R² = 1.21 X%
Here is a bivariate data set. X 51.3 11.7 43.8 -2.9 173.8 27.7 109.3 50.9 40.6 y 19.3 115.1 41.8 63.7 76.9 40.1 46.2 41.6 63.2 26.4 43.5 32.3 66.8 51.6 14.9 36.9 42.9 This data can be downloaded as a *.csv file with this link: Download CSV Find the correlation coefficient and report it accurate to three decimal places. r= 0.110 x What proportion of the variation in y can be explained by the variation in the values of x? Report answer as a percentage accurate to one decimal place. R² = 1.21 X%

Glencoe Algebra 1, Student Edition, 9780079039897, 0079039898, 2018
18th Edition
ISBN:9780079039897
Author:Carter
Publisher:Carter
Chapter10: Statistics
Section10.3: Measures Of Spread
Problem 1GP

Related questions
Question
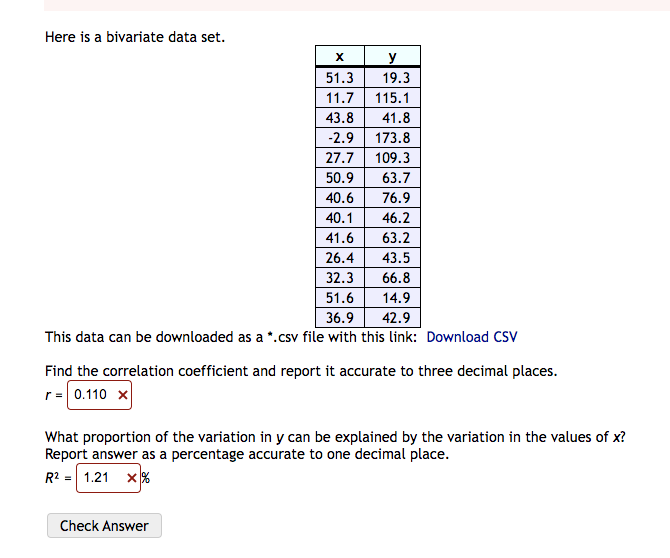
Here is a bivariate data set.
| x | y |
|---|---|
| 51.3 | 19.3 |
| 11.7 | 115.1 |
| 43.8 | 41.8 |
| -2.9 | 173.8 |
| 27.7 | 109.3 |
| 50.9 | 63.7 |
| 40.6 | 76.9 |
| 40.1 | 46.2 |
| 41.6 | 63.2 |
| 26.4 | 43.5 |
| 32.3 | 66.8 |
| 51.6 | 14.9 |
| 36.9 | 42.9 |
Find the
r = Incorrect (NOT 0.110)
What proportion of the variation in y can be explained by the variation in the values of x? Report answer as a percentage accurate to one decimal place.
R² = Incorrect% (NOT 1.21%)
Transcribed Image Text:Here is a bivariate data set.
X
51.3
11.7
43.8
-2.9
27.7
50.9
40.6
40.1
173.8
109.3
63.7
76.9
46.2
63.2
43.5
66.8
51.6
14.9
36.9
42.9
This data can be downloaded as a *.csv file with this link: Download CSV
Check Answer
y
19.3
115.1
41.8
41.6
26.4
32.3
Find the correlation coefficient and report it accurate to three decimal places.
r = 0.110 x
What proportion of the variation in y can be explained by the variation in the values of x?
Report answer as a percentage accurate to one decimal place.
R² = 1.21 X%
Expert Solution
This question has been solved!
Explore an expertly crafted, step-by-step solution for a thorough understanding of key concepts.

This is a popular solution!

Trending now
This is a popular solution!

Step by step
Solved in 3 steps

Recommended textbooks for you
Glencoe Algebra 1, Student Edition, 9780079039897…
Algebra
ISBN:
9780079039897
Author:
Carter
Publisher:
McGraw Hill
Glencoe Algebra 1, Student Edition, 9780079039897…
Algebra
ISBN:
9780079039897
Author:
Carter
Publisher:
McGraw Hill