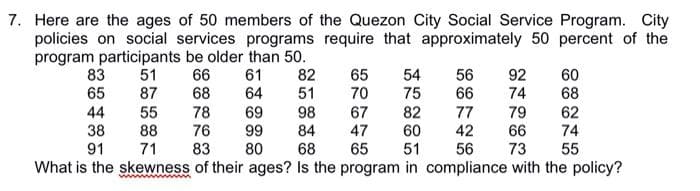
7. Here are the ages of 50 members of the Quezon City Social Service Program. City policies on social services programs require that approximately 50 percent of the program participants be older than 50. 83 66 82 65 54 92 60 51 87 61 64 56 66 65 68 51 70 75 74 68 78 76 83 79 66 44 55 88 71 69 99 98 84 68 67 82 77 62 74 38 91 47 65 60 42 80 51 56 73 55 What is the skewness of their ages? Is the program in compliance with the policy?
Q: The table below gives the number of suicides estimated in the U.S. for a recent year by age, race…
A: Note: Hi there! Thank you for posting the question. As there are multiple sub parts, according to…
Q: 2. The following are the grade point averages of 30 students recently admitted to the graduate…
A:
Q: The ages at death for a sample of 40 residents of postal code N1G are listed below. Find Pg5. 30 35…
A: The value of P85 is obtained below: From the given information, the ages at death for a sample of 40…
Q: The following table lists measured cholesterol levels. Are cholesterol levels affected by an…
A: Introduction: We need to perform three tests- if the cholesterol levels are affected by an…
Q: Suppose you are an expert on the fashion industry and wish to gather information to compare the…
A: In order to determine whether the mean amount earned by Claiborne models is greater than that by…
Q: 7 Consider the data set below representing marks of students in a test. 25 45 20 16 18 39 33 51 13…
A: Given information: The data set representing the marks of students in a test is: 25 45 20 16 18…
Q: 4 The data below shows the ages of a random sample of people visiti museum. 20 23 25 30 32 35 39 44…
A: Stem and leaf is a graphical presentation of the data, where each observation is divided into the…
Q: Suppose the following data show the percentage of 17- to 24-year-olds who are attending college in…
A: Given Information : Suppose the following data show the percentage of 17- to 24-year-olds who are…
Q: The most obese countries in the world have obesity rates that range from 11.4% to 2. 74.6%. This…
A: Solution: Consider the given data. Let f : Number of countries for each class of percent Find the…
Q: Suppose that the frequency table below contains data on female life expectancy at birth in 91…
A: We have given the frequency table below contains data on female life expectancy at birth in 91…
Q: You intend to estimate a population mean μ from the following sample. 49.5 43.2 92.8 60.2 77 104.8…
A: Confidence interval is an inference process which gives the range of plausible values of population…
Q: The United States has an aging infrastructure as witnessed by several recent disasters, including…
A: The box plot is used to depict the distribution of dataset. For horizontal box plots, the left end…
Q: 2. The following table displays the ages of male actors when they starred in their Oscar-swimming…
A: Mean = (Summation of terms/ number of terms) Here, number of terms is 30 And summation of ages of…
Q: uppose the following data show the percentage of 17- to 24-year-olds who are attending college in…
A: Anova: Single Factor SUMMARY Groups Count Sum Average Variance…
Q: A group reported the accompanying annual rainfall (in inches) for a particular city in Oregon over a…
A:
Q: Suppose the following data show the percentage of 17- to 24-year-olds who are attending college in…
A: The table represents the percentage of 17-to-24 year old who are attending college in several…
Q: The table shows the marital status of the U.S. population in 2010. Numbers in the table are…
A:
Q: A statistics class with 60 students were given an examination and the results are shown below. 88 47…
A: First we arrange the data set in ascending order so it would be easy to count the frequencies for…
Q: The United States has an aging infrastructure as witnessed by several recent disasters, including…
A: Given data…
Q: What are some similarities and differences of race and ethnicity distribution across swing states…
A: In the above question we are asked to find similarities and differences of race and ethnicity…
Q: The following table presents the ages of 9 U.S. presidents and their wives on the first day of…
A:
Q: Consider the population below. 16 17 32 34 29 14 17 29 O 18 39 13 15 12 36 35 The sample below was…
A: Given information: The data represents the values of population and sample.
Q: Suppose that a 2012 National Health Interview Survey gives the nu which gives the number of adults…
A: Solution
Q: he number of passengers (in thousands) for the leading U.S. passenger airlines in 2004 is indicated…
A: Obtain the frequency distribution table and the cumulative frequency distribution The frequency…
Q: The pass completion percentages of 10 college football quarterbacks for their freshman and sophomore…
A: a) The data shows the pass completion percentages of 10 college football quarterbacks for their…
Q: The following table contains the number of complaints received in a department store for the first 6…
A: The idea behind the naive method for forecasting is to simply choose the data value from the…
Q: 2. The following data represent the number of live multiple-delivery births (three or more babies)…
A: Given: Age Number of multiple births 15-19 44 20-24 404 25-29 1204 30-34 1872 35-39…
Q: A statistics class with 60 students were given an examination and the results are shown below. 73 57…
A: Results of 60 students were given, we need to make a frequency distribution table.
Q: Complete the following table using the sample of 10 IQ scores. Xi Xi - (Xi - )2 91 93 103…
A: X bar = (summation Xi)/n Then we find (Xi-X bar )2 We know that, SS=summation (Xi-X bar)2 S2=…
Q: The cross-chart regarding the distribution of 1620 people according to the sports branches they are…
A: We need to identify the size of chart from the given information.
Q: 4. A mathematics placement test is given to all entering freshmen at a small college. A student who…
A: For the given data graph the estimated regression line
Q: 2. The VP for Academic Affairs of UPang wished to understand the distribution of students in the…
A:
Q: solve for the point estimate of the population parameter µ. Percentage of parents in favor of…
A:
Q: The following data values are per capita expenditures on public libraries for each of the 50 states.…
A: Here, per capita expenditures on public libraries for the 50 states are given. A histogram is needed…
Q: The population mean, according to a report is 19.6 minutes. To corroborate this, a sample of 33…
A: It is given that the population mean is 19.6 and the sample size is 33.
Q: The test scores of 40 students are listed below. Find P85. 30 35 43 44 47 48 54 55 56 57 59 62 63…
A: Here, number of students are N=40. Now, arrange the data in an ascending order. Then, 85th…
Q: Sony: 10.0% Apple: 30.0% Nokia: 16.0% Huawe i: 25.0% Samsung 20.0% Apple ISamsung Huawei Nokia WI…
A: The percent of people who like Huawei brand, percent = 25.0% The total number of people surveyed is…
Q: The map below shows the percentage change in housing prices from June 2014 to June 2015 in each of…
A: a. not mutually exclusive
Q: 2. The following are the grade point averages of 30 students recently admitted to the graduate…
A:
Q: The estimated daily living costs for an executive traveling to various major cities follow. The…
A: It is given that the estimated daily living costs for an executive travelling to various major…
Q: The following tables list the ages of female and male actors when they starred in their…
A: The data set for female and male actors is: Female Actors Male Actors 57 45 76 54…
Q: The United States has an aging infrastructure as witnessed by several recent disasters, including…
A: Given Information: Consider the given data, 3.42 3.97 4.25 4.32 4.36 4.41 4.51…
Q: 2. The following are the grade point averages of 30 students recently admitted to the graduate…
A:
Q: 2. The following are the grade point averages of 30 students recently admitted to the graduate…
A:
Q: The population mean, according to a report, is 19.6 minutes. To corroborate this, a sample of 33…
A: Introduction: Denote μ as the true population mean time (minutes). Based on the claim, the null and…
Q: A frequency table about degrees of 40 CEOs was given: Degree Frequency Bachelors 8 Laws 4 Masters…
A: given that frequency table about degrees of 40 CEOs was given: Degree Frequency Bachelors 8…
Q: 2. Below are the distances travelled (km) by a sample of workers of a call center on their way to…
A: Given the data 5.0 30.3 14.7 19.2 6.2 9.0 19.6 22.9 41.6 11.4 17.3 31.1 9.6 12.8 12.2…
Q: A group reported the accompanying annual rainfall (in inches) for a particular city in Oregon over a…
A: Given: n = 59 Formula Used: Relative frequency = Frequencyn
Q: 2. The following are the grade point averages of 30 students recently admitted to the graduate…
A:
Q: 23. Calculate the coefficient of concurrent deviation from the following: 60 55 50 56 30 70 40 35 80…
A:
Trending now
This is a popular solution!
Step by step
Solved in 3 steps
- 4. The number of passengers (in thousands) for the leading U.S. passenger airlines in 2004 is indicated below. 91,570 86,755 81,066 70,786 55,373 42,400 40,551 21,119 16,280 14,869 13,659 13,417 13,170 12,632 11,731 10,420 10,024 9,122 7,041 6,954 6,406 6,362 5,930 5,585 5,427• Use the data to construct a grouped frequency distribution and a cumulative frequency distribution with a reasonable number of classes and comment on the shape of the distribution using graph.Suppose we want to estimate the annual high temperatures of the hottest major cities in the United States. Below is data from 12 cities with the average annual temperature taken from 1971 to 2000 City Temperature (Fahrenheit) Phoenix, Arizona 87.2 Miami, Florida 84.3 Orlando, Florida 82.8 Riverside, California 80.9 Austin, Texas 79.8 Houston, Texas 79.7 San Antonio, Texas 80.3 Las Vegas, Nevada 80.1 Jacksonville, Florida 79.3 New Orleans, Louisiana 78.2 Tampa, Florida 81.7 Los Angeles, California 75.2 What's the population for this study? What's the sample for this study?1) Country Population Cases, total Deaths, total China 1,439,323,776 93,329 4,750 India 1,380,004,385 9,392,919 136,696 USA 331,002,651 12,939,666 262,736 Indonesia 273,523,615 527,999 16,646 Pakistan 220,892,340 392,356 7,942 Brazil 212,559,417 6,238,350 171,974 Nigeria 206,139,589 67,330 1,171 Bangladesh 164,689,383 460,619 6,580 Russia 145,934,462 2,269,316 39,527 Mexico 128,932,753 1,090,675 104,873 Japan 126,476,461 144,653 2,106 Ethiopia 114,963,588 108,930 1,695 Philippines 109,581,078 427,797 8,333 Egypt 102,334,404 115,183…
- The following table shows the number of active military personnel in 2009, by region (including the District of Columbia). Pacific 229,634 Mountain 89,816 West South Central 177,336 West North Central 64,564 East North Central 26,384 East South Central 68,440 South Atlantic 376,034 Middle Atlantic 41,441 New England 8,579 Source: U.S. Census Bureau, Statistical Abstract of the United States: 2012, Table 508 (data) and U.S. Census Bureau, Census Regions and Divisions of the United States (regions). Calculate the mean and standard deviation for the population. Now take 10 samples of size 3 from the population. Use either simple random sampling or systematic sampling with the help of the table of random numbers in Appendix A. Calculate the mean for each sample. Once you have calculated the mean for each sample, calculate the mean of means (i.e., add up your 10 sample means and divide by 10). How does this mean compare with the mean for all…The following table shows the number of active military personnel in 2009, by reglon (including the District of Columbia). 229,834 Mountain 89,816 West South Central 177,336 Pacific West North Central 64,564 East North Central 26,384 East South Central 68,440 South Atlantic 376.034 Middle Atlantic 4 41,441 New England 8,579 Source: U.S. Census Bureau, Statistical Abstract of the United States: 2012, Table 508 (data) and U.S. Census Bureau, Census Regions and Divisions of the United States (regions) a. Calculate the mean and standard deviation for the population. b. Now take 10 samples of size 3 from the population. Use either simple randonm sampling or systematic sampling with the help of the table of random numbers in Appendix A. Calculate the mean for each sample. c. Once you have calculated the mean for each sample, calculate the mean of means (ie., add up your 10 sample means and divide by 10). How does this mean compare with the mean for all states? How does the value of the…