15 20 25 30 (c) Find the sample correlation coefficient r and the coefficient of determination. (Round your answers to three decimal places.) r= 2²= What percentage of variation in y is explained by the least-squares model? (Round your answer to one decimal place.) % (d) If a female baby weighs 17 pounds at 1 year, what do you predict she will weigh at 30 years of age? (Round your answer to two decimal places.) lb
15 20 25 30 (c) Find the sample correlation coefficient r and the coefficient of determination. (Round your answers to three decimal places.) r= 2²= What percentage of variation in y is explained by the least-squares model? (Round your answer to one decimal place.) % (d) If a female baby weighs 17 pounds at 1 year, what do you predict she will weigh at 30 years of age? (Round your answer to two decimal places.) lb

Glencoe Algebra 1, Student Edition, 9780079039897, 0079039898, 2018
18th Edition
ISBN:9780079039897
Author:Carter
Publisher:Carter
Chapter10: Statistics
Section10.1: Measures Of Center
Problem 9PPS

Related questions
Question
Transcribed Image Text:130
120
110
10
15
20
25
30
X
130-
120
110
10
15
20
25
30
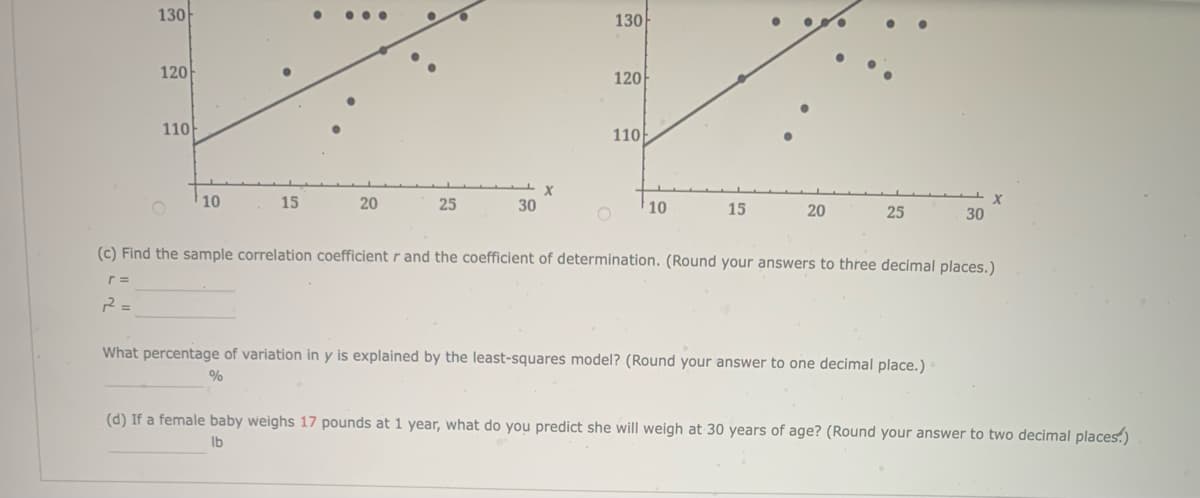
What percentage of variation in y is explained by the least-squares model? (Round your answer to one decimal place.)
%
X
(c) Find the sample correlation coefficient r and the coefficient of determination. (Round your answers to three decimal places.)
r=
2=
(d) If a female baby weighs 17 pounds at 1 year, what do you predict she will weigh at 30 years of age? (Round your answer to two decimal places.)
lb
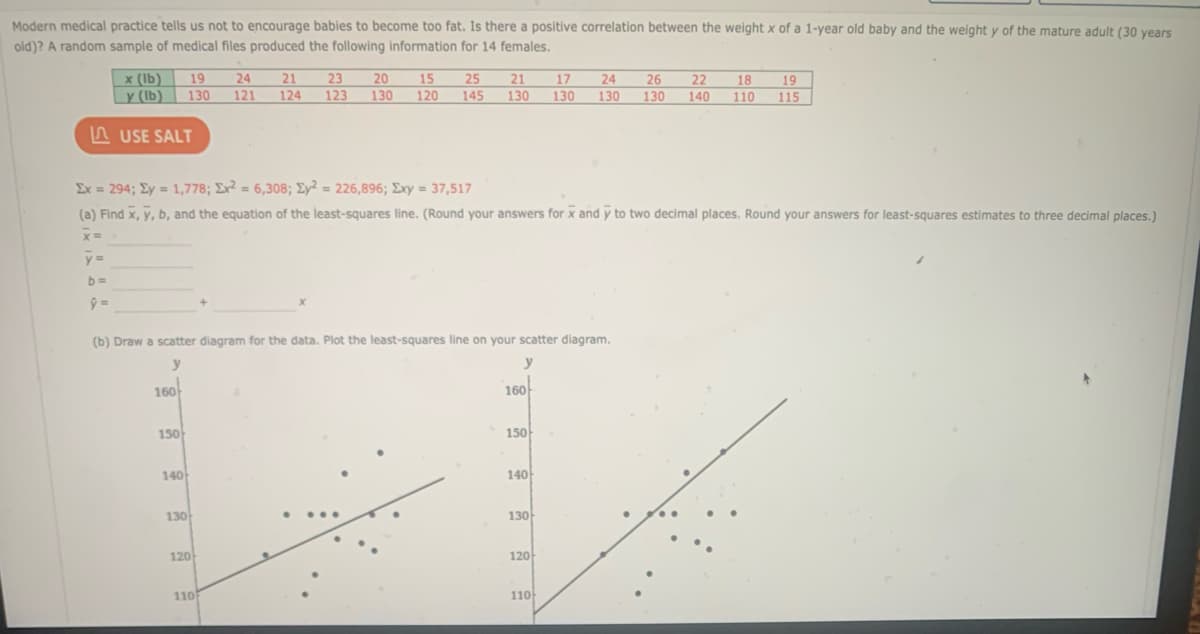
Transcribed Image Text:Modern medical practice tells us not to encourage babies to become too fat. Is there a positive correlation between the weight x of a 1-year old baby and the weight y of the mature adult (30 years
old)? A random sample of medical files produced the following information for 14 females.
19
24
21
23
20
x (lb)
y (lb) 130 121 124 123 130 120
USE SALT
y =
b=
9=
Σχ = 294; Σy = 1,778; Σx2 = 6,308; Σy2 = 226,896; Σxy = 37,517
(a) Find x, y, b, and the equation of the least-squares line. (Round your answers for x and y to two decimal places. Round your answers for least-squares estimates to three decimal places.)
x=
160
(b) Draw a scatter diagram for the data. Plot the least-squares line on your scatter diagram.
y
150
140
130
15 25
145
120
21 17 24 26 22 18 19
130 130 130 130 140 110 115
110
y
160
150
T
140
130
120
110
Expert Solution
This question has been solved!
Explore an expertly crafted, step-by-step solution for a thorough understanding of key concepts.

Step by step
Solved in 4 steps with 1 images

Recommended textbooks for you
Glencoe Algebra 1, Student Edition, 9780079039897…
Algebra
ISBN:
9780079039897
Author:
Carter
Publisher:
McGraw Hill
Glencoe Algebra 1, Student Edition, 9780079039897…
Algebra
ISBN:
9780079039897
Author:
Carter
Publisher:
McGraw Hill