15. Another supply and demand puzzle The market price of pizzas in a college town decreased recently, and the students in an economics class are debating the cause of the price decrease. Some students suggest that the price decreased because several new pizza parlors have recently opened in the area. Other students attribute the decrease in the price of pizzas to a recent increase in the price of beer. Everyone agrees that the increase in the price of beer was caused by a recent increase in the price of grain, which is not generally used in making pizzas. The first group of students thinks the decrease in the price of pizzas is due to the fact that several new pizza parlors have recently opened in the area. On the following graph, adjust the supply and demand curves to illustrate the first group’s explanation for the decrease in the price of pizzas. Note: Select and drag one or both of the curves to the desired position. Curves will snap into position, so if you try to move a curve and it snaps back to its original position, just drag it a little farther.
15. Another supply and demand puzzle The market price of pizzas in a college town decreased recently, and the students in an economics class are debating the cause of the price decrease. Some students suggest that the price decreased because several new pizza parlors have recently opened in the area. Other students attribute the decrease in the price of pizzas to a recent increase in the price of beer. Everyone agrees that the increase in the price of beer was caused by a recent increase in the price of grain, which is not generally used in making pizzas. The first group of students thinks the decrease in the price of pizzas is due to the fact that several new pizza parlors have recently opened in the area. On the following graph, adjust the supply and demand curves to illustrate the first group’s explanation for the decrease in the price of pizzas. Note: Select and drag one or both of the curves to the desired position. Curves will snap into position, so if you try to move a curve and it snaps back to its original position, just drag it a little farther.

Chapter4: Demand, Supply, And Market Equilibrium
Section: Chapter Questions
Problem 6P

Related questions
Question
15. Another supply and demand puzzle
The market price of pizzas in a college town decreased recently, and the students in an economics class are debating the cause of the price decrease. Some students suggest that the price decreased because several new pizza parlors have recently opened in the area. Other students attribute the decrease in the price of pizzas to a recent increase in the price of beer. Everyone agrees that the increase in the price of beer was caused by a recent increase in the price of grain, which is not generally used in making pizzas.
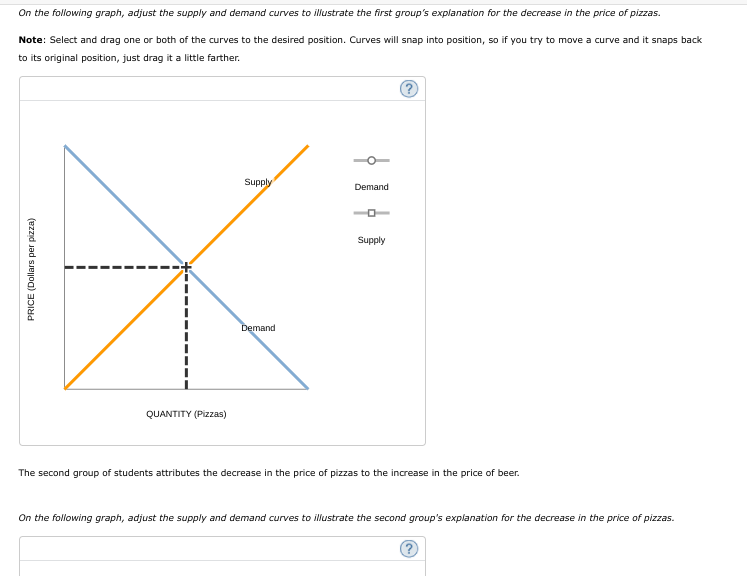
The first group of students thinks the decrease in the price of pizzas is due to the fact that several new pizza parlors have recently opened in the area.
On the following graph, adjust the supply and demand curves to illustrate the first group’s explanation for the decrease in the price of pizzas.
Note: Select and drag one or both of the curves to the desired position. Curves will snap into position, so if you try to move a curve and it snaps back to its original position, just drag it a little farther.
Transcribed Image Text:On the following graph, adjust the supply and demand curves to illustrate the first group's explanation for the decrease in the price of pizzas.
Note: Select and drag one or both of the curves to the desired position. Curves will snap into position, so if you try to move a curve and it snaps back
to its original position, just drag it a little farther.
Supply
Demand
Supply
Demand
QUANTITY (Pizzas)
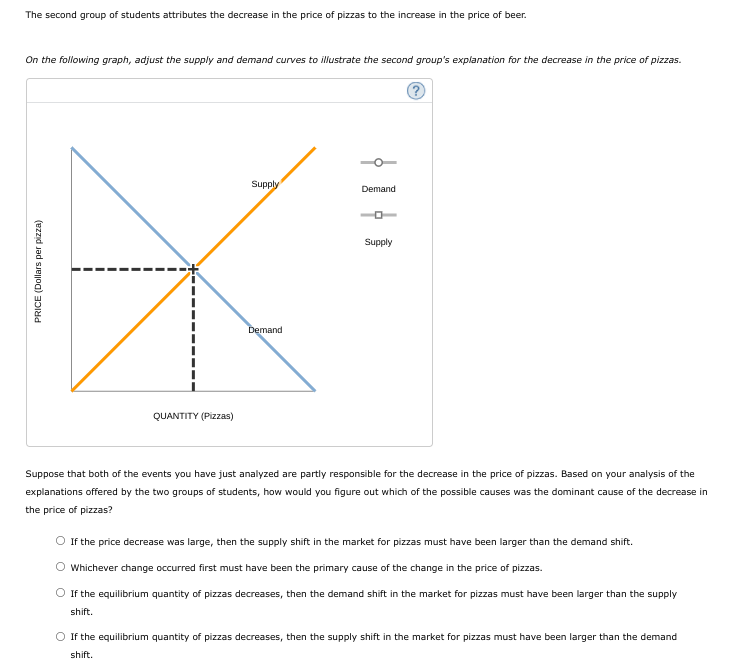
The second group of students attributes the decrease in the price of pizzas to the increase in the price of beer.
On the following graph, adjust the supply and demand curves to illustrate the second group's explanation for the decrease in the price of pizzas.
PRICE (Dollars per pizza)
Transcribed Image Text:The second group of students attributes the decrease in the price of pizzas to the increase in the price of beer.
On the following graph, adjust the supply and demand curves to illustrate the second group's explanation for the decrease in the price of pizzas.
Supply
Demand
Supply
Demand
QUANTITY (Pizzas)
Suppose that both of the events you have just analyzed are partly responsible for the decrease in the price of pizzas. Based on your analysis of the
explanations offered by the two groups of students, how would you figure out which of the possible causes was the dominant cause of the decrease in
the price of pizzas?
If the price decrease was large, then the supply shift in the market for pizzas must have been larger than the demand shift.
Whichever change occurred first must have been the primary cause of the change in the price of pizzas.
O If the equilibrium quantity of pizzas decreases, then the demand shift in the market for pizzas must have been larger than the supply
shift.
If the equilibrium quantity of pizzas decreases, then the supply shift in the market for pizzas must have been larger than the demand
shift.
PRICE (Dollars per pizza)
Expert Solution
This question has been solved!
Explore an expertly crafted, step-by-step solution for a thorough understanding of key concepts.

This is a popular solution!

Trending now
This is a popular solution!

Step by step
Solved in 2 steps with 2 images

Knowledge Booster


Learn more about
Need a deep-dive on the concept behind this application? Look no further. Learn more about this topic, economics and related others by exploring similar questions and additional content below.Recommended textbooks for you
Exploring Economics
Economics
ISBN:
9781544336329
Author:
Robert L. Sexton
Publisher:
SAGE Publications, Inc


Exploring Economics
Economics
ISBN:
9781544336329
Author:
Robert L. Sexton
Publisher:
SAGE Publications, Inc

Essentials of Economics (MindTap Course List)
Economics
ISBN:
9781337091992
Author:
N. Gregory Mankiw
Publisher:
Cengage Learning

Brief Principles of Macroeconomics (MindTap Cours…
Economics
ISBN:
9781337091985
Author:
N. Gregory Mankiw
Publisher:
Cengage Learning
