15. If x₁=Y1+ y2, X2 = y2 + Y3, x3 = y3+y₁, where y₁, y2 y3 are correlated variables each of which has zero mean and unit standard deviation, find the multiple correlation coefficient x₁ and the two variables X2, X2.
15. If x₁=Y1+ y2, X2 = y2 + Y3, x3 = y3+y₁, where y₁, y2 y3 are correlated variables each of which has zero mean and unit standard deviation, find the multiple correlation coefficient x₁ and the two variables X2, X2.

Linear Algebra: A Modern Introduction
4th Edition
ISBN:9781285463247
Author:David Poole
Publisher:David Poole
Chapter2: Systems Of Linear Equations
Section2.4: Applications
Problem 2EQ: 2. Suppose that in Example 2.27, 400 units of food A, 500 units of B, and 600 units of C are placed...

Related questions
Question
100%
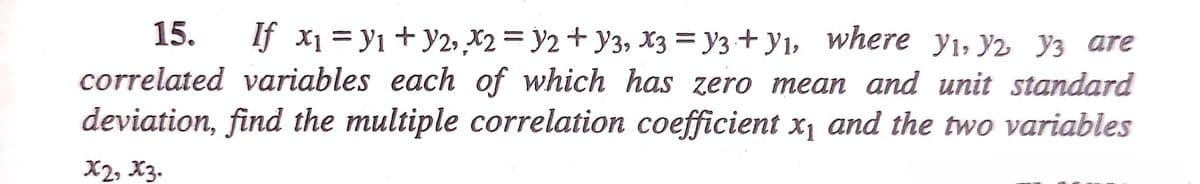
Transcribed Image Text:15. If x₁ = y₁ + y2, X2 = y2 + Y3, x3 = y3+y₁, where y₁, y2 y3 are
correlated variables each of which has zero mean and unit standard
deviation, find the multiple correlation coefficient x₁ and the two variables
X2, X3.
Expert Solution
This question has been solved!
Explore an expertly crafted, step-by-step solution for a thorough understanding of key concepts.

Step by step
Solved in 2 steps with 2 images

Recommended textbooks for you
Linear Algebra: A Modern Introduction
Algebra
ISBN:
9781285463247
Author:
David Poole
Publisher:
Cengage Learning
Linear Algebra: A Modern Introduction
Algebra
ISBN:
9781285463247
Author:
David Poole
Publisher:
Cengage Learning