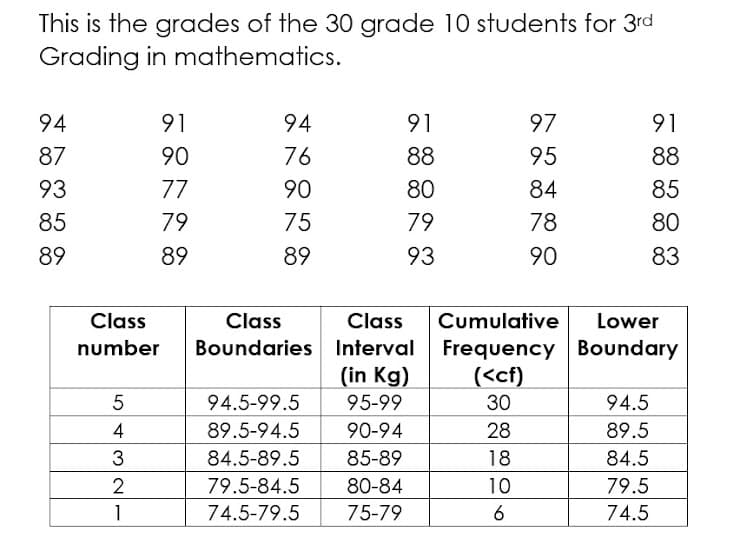
What is the class mark of the Median Class?


Q: To determine which of the two models above – BIG or small – is statistically superior at the .05…
A:
Q: Make up a question that would involve interpolation and the use of the model (regression equation)…
A: Since the question number is not specified, we'll be answering the first question only. Please…
Q: . Which of the variables is quantitative? a. the name of the division holding the meeting b.…
A: Quantitative variable: The variable which can take numerical values is called quantitative variable.
Q: 2. A student has the following quiz scores: 5, 8, 16, 17, 18, 20. Find the standard deviation for…
A: We have given that, The data set are:- 5, 8, 16, 17, 18, 20 Then, We will find the standard…
Q: A random sample of 10 students in IPTS recorded the following expenses in rm july 123 251 102 135…
A:
Q: 4. After seven netball matches, Kai has averaged 11 goals per game. a. Find the value of a. 7 a 9 13…
A:
Q: IQ is normally distributed with a mean of 100 and a standard deviation of 15. When selecting…
A: Given information- Population mean, µ = 100 Population standard deviation, σ = 15 Sample size, n =…
Q: 3. A factory owner alleged that his manufacturing business emits carbon at an average of 1.2% with a…
A: Given : sample size, n =10 sample mean, x̄ =1.25 population standard deviation,σ=0.45…
Q: A clinical trial tests a method designed to increase the probability of conceiving a girl. In the…
A: We have given that, Favorable cases (X) = 322 and sample size (n) = 644 Then, We will find the 99%…
Q: Write your answer on the threaded reply below. Feel free to message me if you need assistance on how…
A: Given that The following table shows the approximate number of wireless telephone subscriptions in…
Q: reedom, why is it n-2? I get n=20, but where did the 2 co
A: Given: coefficient of intercept is 3.402, coefficient of PX is –2.2, coefficient of PY is 1.8…
Q: Salaries of 33 college graduates who took a statistics course in college have a mean, x, of…
A:
Q: During a barangay census, the following information was acquired. 15 children out of 23 are…
A: Solution: The given information can be written in tabular form as given below Children…
Q: Consider the data below. Three random samples in different cities were selected. Water use per…
A: As per our guidelines we can solve first three sub part of question and rest can be reposted.…
Q: Whats the critical value?
A: The null and alternative hypothesis is, The type of the test is two tailed test The level of…
Q: 5. What is the value of n? 6. At α = 0.10, what is the critical value? 7. The type of test that we…
A: Given that Sample mean =41.24 Standard deviation =10 Population mean μ =40 NOTE:- According to…
Q: 4. We have the temperatures in several cities of Spain: Aviles (11°C), Barcelona (17°C), Madrid…
A: The question is based on descriptive statistics Given : The temperatures in several cities areas…
Q: Data point X value is 120 and has an assigned weight of 5 Data point Y value is 300 and has an…
A: Given that Data point X value = 120 and assigned weight(W1) = 5 Data point Y value =300 and…
Q: A researcher is interested in investigating whether the military branch a person signs up for and…
A: Formula : Test statistic
Q: A medical statistician wanted to examine the relationship between the amount of sunshine (x) and…
A: Solution-: Given data: Let, X=Average daily sunshine and Y=Skin cancer per 100,000 (a) Draw a…
Q: A medical researcher treats 400 subjects with high cholesterol using a new drug. After two months of…
A: According to the given information in this question There are two questions according to bartleby we…
Q: 4. The table shows the number C of cars in an office parking lot over the course of a work day. The…
A:
Q: A new sensor was developed by ABY Inc. that is to be used for their obstacle detection system.…
A: Note: In case of multiple subparts, as per the guidelines answer to first three subparts would be…
Q: Consider the random sample of college students. Data on gender and Full or Part-time student course…
A:
Q: 1. The chance of success of an event is the square of the chance of a second event but the odds…
A:
Q: Suppose we have the following data collected from three randomly-selected counties 1.How many…
A: Given: Sample size n = 3 Formula Used: Degree of freedom = n-2 Correlation coefficient r =…
Q: Ana has a team composed of ten juniors and twelve sophomores. What is the probability that a…
A: Given,no.of juniors =10no.of sophomores=12Total no.of team members=22
Q: Explain the representation of population regression function (PRF) and the representation of sample…
A: Population Regression Function: It is the line that passes through the conditional means of the…
Q: A. A random sample of 100 recorded deaths in the United State during the past year showed an average…
A: According to policy we supposed to answer three part Please repost question for remaining
Q: For numbers 9 and 10: Nathan, a friend of Jonard, wants to predict the petal length (plength, cm) of…
A: Solution: The regression output is given. Here, the dependent variable is petal length. Independent…
Q: When making random guesses on an 6 question quiz the probability of guessing correctly on any one…
A:
Q: b) Given the following data: Month Sales Month Sales January February March April May June 25.0 31.0…
A: Since you have posted a question with multiple sub-parts, we will solve the first three sub-parts…
Q: 10 It is known that 15% of a large constituency voted for the Working Together Party (WTP) at the…
A: Let there are n trials and each having two outcomes - Success and Failure. The trials are…
Q: variable X has a binomial distribution. If it does, state the number of trials n. If it does not,…
A:
Q: In Happy Town, Kate sells at most 40 Oran Berries per day. Her sister, Anna, feels that she is…
A: The following information has been provided Hypothesized population = 40 Sample mean = 41.24 Sample…
Q: A magazine provided results from a poll of 500 adults who were asked to identify their favorite pie.…
A: It is given that: p^ (proportion of adults, who lie chocolate pie at the sample level)=11% (i..e,…
Q: It is tested by a statistical test. a. Null hypothesis b. Alternative hypothesis c. Test statistic…
A: Given that
Q: If X and Y are two independent random variables, then Mx,y (V) = Mx(v)M,(v) X.
A:
Q: observational
A: Given, Q.1 Some researchers have noted that adolescents who spend a lot of time playing video or…
Q: Show that any uncorrelated Gaussian random variables are statistically independent.
A:
Q: What is the degrees of freedom?
A:
Q: heck if there is a significant difference between the 1st and 2nd measurement of weight at 10% level…
A: There are 2 independent samples which are 1st Measurement and 2nd Measurement. We have to test…
Q: Example 11.6 Suppose that a simple random sample of 400 families shows that 320 families own a…
A:
Q: A survey of 10 students was conducted to investigate the amount of time they spend on social media…
A: ''Since you have asked multiple questions, we will solve the first question for you. If you want any…
Q: 3. We throw a dice 10 times consecutively, obtaining the results: 1, 1, 1, 3, 3, 4, 4, 5, 6, 6.…
A: Solution-: We throw a dice 10 times. We obtain the following results: 1,1,1,3,3,4,4,5,6,6 We…
Q: Lesson: Poisson Distribution 1. The marketing manager of a company has noted that she usually…
A:
Q: A person’s phone bills for the last three months were $20, $75, and $55, respectively. What was the…
A: Given n=3
Q: Use a graphing calculator to make a scatter plot of the amounts Leah will accumulate for years 1…
A: Given: Year Amount with interest Deposit Total amount 0 1200 1200 1 1255.13 1200 2455.13…
Q: Suppose we examined medical records of 500 individuals admitted to the hospital, and we…
A: Given that, medical records of 500 individuals admitted to the hospital were examined, and…
Q: List down five (5) different real-life situations where hypothesis testing can be done. Identify the…
A: 1. Income: Compariosion os male and female earnings The income of male is higher than female

Step by step
Solved in 2 steps with 1 images

- Is the number of games won by a major league baseball team in a season related to the team batting average? The table below shows the number of games won and the batting average (in thousandths) of 8 teams. Team Games Won Batting Average 1 6060 259259 2 120120 277277 3 8989 263263 4 101101 288288 5 8585 287287 6 109109 270270 7 7777 272272 8 106106 290290 Using games won as the explanatory variable xx, do the following: (a) The correlation coefficient is r=r= . (b) The equation of the least squares line is y^=y^= . SpeakIs the number of games won by a major league baseball team in a season related to the team batting average? The table below shows the number of games won and the batting average (in thousandths) of 8 teams. Team Games Won Batting Average 1 8383 289289 2 116116 290290 3 101101 287287 4 8181 262262 5 110110 288288 6 119119 269269 7 6060 268268 8 6161 280280 Using games won as the explanatory variable xx, do the following: (a) The correlation coefficient is r=r= . (b) The equation of the least squares line is y^=y^=Is the number of games won by a major league baseball team in a season related to the team batting average? The table below shows the number of games won and the batting average (in thousandths) of 8 teams. Team Games Won Batting Average 1 9797 269269 2 9595 275275 3 8686 273273 4 9999 261261 5 6464 285285 6 118118 260260 7 8787 274274 8 8888 280280 Using games won as the explanatory variable ?x, compute the correlation coefficient
- The following data represent the monthly phone use, in minutes, of a customer enrolled in a fraud prevention program for the past 20 months. The phone company decides to use the upper fence as the cutoff point for the number of minutes at which the customer should be contacted. What is the cutoff point? 510398398515357327480491308408483394320338463321374307538409The following data has been collected on the interarrival times of patients to an emergency department: 3.772, 1.761, 0.743, 15.988, 0.412, 7.541, 6.900, 3.447, 7.024, 1.061, 5.449, 0.309, 0.766, 4.807, 8.143, 0.093, 9.524, 0.012, 4.634, and 0.195 minutes. Estimate the squared coefficient of variation of the arrival process. Is the arrival process likely to be Poisson? Why or why not? Estimate the arrival rate?Data collected by a price reporting agency from more than 90,000 gasoline and convenience stores throughout the U.S. showed that the average price for a liter of unleaded gasoline was $0.87. The following data show the price per liter ($) for a sample of 20 gasoline and convenience stores located in San Francisco. 0.97 0.97 1.29 0.92 0.96 0.96 0.98 0.93 1.01 0.96 0.96 0.97 0.96 1.03 1.12 0.95 0.94 1.01 0.93 0.92 (a) Use the sample data to estimate the mean price in dollars for a liter of unleaded gasoline in San Francisco. (Round your answer to three decimal places.) (b) Compute the sample standard deviation in dollars. (Round your answer to three decimal places.) (c) Compare the mean price per liter for the sample data to the national average price. What conclusions can you draw about the cost of living in San Francisco? The average price for a liter of unleaded gasoline in San Francisco is lower than/higher than/same as the national average. This indicates…
- Data collected by a price reporting agency from more than 90,000 gasoline and convenience stores throughout the U.S. showed that the average price for a liter of unleaded gasoline was $0.87. The following data show the price per liter ($) for a sample of 20 gasoline and convenience stores located in San Francisco. 0.97 0.97 1.25 0.92 0.92 1.00 0.94 0.97 1.01 0.96 0.96 0.97 0.92 1.03 1.12 0.95 0.98 0.97 0.97 0.96 (a) Use the sample data to estimate the mean price in dollars for a liter of unleaded gasoline in San Francisco. (Round your answer to three decimal places.) $ (b) Compute the sample standard deviation in dollars. (Round your answer to three decimal places.) $ (c) Compare the mean price per liter for the sample data to the national average price. What conclusions can you draw about the cost of living in San Francisco? The average price for a liter of unleaded gasoline in San Francisco is the national average. This indicates that the cost of living in San…A(n) _______ uses line segments to connect points located directly above class midpoint values.The data below shows car model and the color of vehicles sold at a Car dealership.Hyundai Honda Toyota Daihatsu Subaru TotalRed 2015.40118.648613.518*54.5950Black 1516.9569.511814.8698.6275.0555White 2224.651513.842621.621212.5457.35**Total 57 32 50 29 17 185Chi Sq =1.37 + 0.64 + 4.18 + 0.00 + 0.04 +0.22 + 1.30 + *** + 0.02 + 0.75 +0.28 + 0.10 + 0.89 + 0.02 + 0.75 = 10.47DF = ****, P-Value = *****No cells with expected counts less than 5a) Carefully define the null and alternative hypotheses of the χ2 test underlying the generation of the above table.
- The data below shows car model and the color of vehicles sold at a Car dealership.Hyundai Honda Toyota Daihatsu Subaru TotalRed 2015.40118.648613.518*54.5950Black 1516.9569.511814.8698.6275.0555White 2224.651513.842621.621212.5457.35**Total 57 32 50 29 17 185Chi Sq =1.37 + 0.64 + 4.18 + 0.00 + 0.04 +0.22 + 1.30 + *** + 0.02 + 0.75 +0.28 + 0.10 + 0.89 + 0.02 + 0.75 = 10.47DF = ****, P-Value = *****No cells with expected counts less than 5a) Carefully define the null and alternative hypotheses of the χ2 test underlying thegeneration of the above table.b) Fill in the missing values ‘*’, ‘**’, ‘***’, ‘****’ and ‘*****’.c) What is the conclusion of this test at the 5% level of significance? Give reasons for youranswer.d) Name two limitations of this test.The data below shows car model and the color of vehicles sold at a Car dealership.Hyundai Honda Toyota Daihatsu Subaru TotalRed 2015.40118.648613.518*54.5950Black 1516.9569.511814.8698.6275.0555White 2224.651513.842621.621212.5457.35**Total 57 32 50 29 17 185Chi Sq =1.37 + 0.64 + 4.18 + 0.00 + 0.04 +0.22 + 1.30 + *** + 0.02 + 0.75 +0.28 + 0.10 + 0.89 + 0.02 + 0.75 = 10.47DF = ****, P-Value = *****No cells with expected counts less than 5 b) Fill in the missing values ‘*’, ‘**’, ‘***’, ‘****’ and ‘*****’. c) What is the conclusion of this test at the 5% level of significance? Give reasons for your answer. d) Name two limitations of this testThe following are the drying times (minutes) of 100sheets coated with polyurethane under various ambientconditions:45.6 50.3 55.1 63.0 58.2 65.5 51.1 57.4 60.4 54.956.1 62.1 43.5 63.8 64.9 59.9 63.0 67.7 53.8 57.961.8 52.2 61.2 51.6 58.6 73.8 53.9 64.1 57.2 75.455.9 70.1 46.2 63.6 56.0 48.1 62.2 58.8 50.8 68.151.4 73.9 66.7 42.9 71.0 56.1 60.8 58.6 70.6 62.259.9 47.5 72.5 62.0 56.8 54.3 61.0 66.3 52.6 63.564.3 63.6 53.5 55.1 62.8 63.3 64.7 54.9 54.4 69.664.2 59.3 60.6 57.1 68.3 46.7 73.7 56.8 62.9 58.468.5 68.9 62.1 62.8 74.4 43.8 40.0 64.4 50.8 49.955.8 66.8 67.0 64.8 57.6 68.3 42.5 64.4 48.3 56.5Construct a frequency distribution of these data, usingeight classes.


