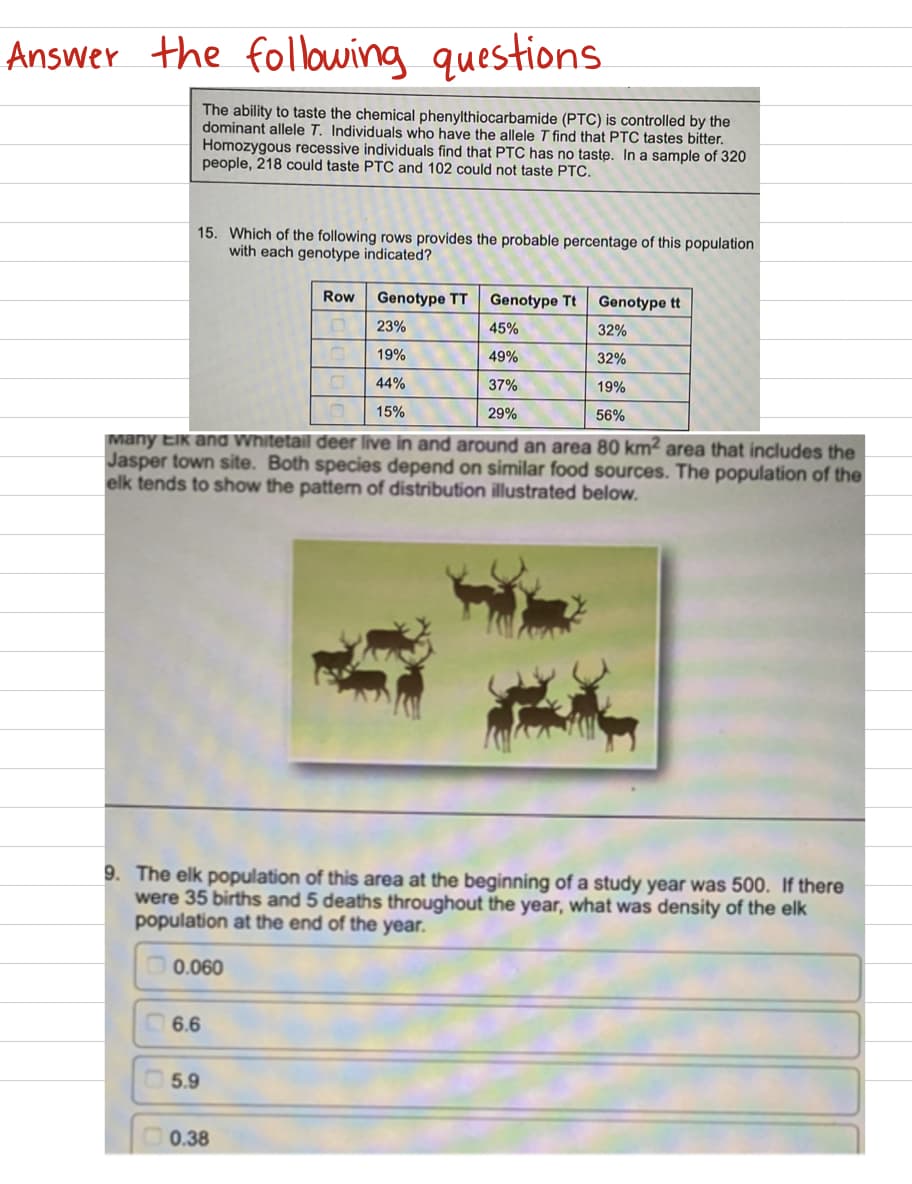
15. Which of the following rows provides the probable percentage of this population with each genotype indicated? The ability to taste the chemical phenylthiocarbamide (PTC) is controlled by the dominant allele T. Individuals who have the allele T find that PTC tastes bitter. Homozygous recessive individuals find that PTC has no taste. In a sample of 320 people, 218 could taste PTC and 102 could not taste PTC. Genotype TT Genotype Tt Genotype tt 23% 45% 32% 19% 49% 32% 44% 37% 19% 15% 29% 56% Many Elk and Whitetail deer live in and around an area 80 km2 area that includes the Jasper town site. Both species depend on similar food sources. The population of the elk tends to show the pattern of distribution illustrated below. 9. The elk population of this area at the beginning of a study year was 500. If there were 35 births and 5 deaths throughout the year, what was density of the elk population at the end of the year. 0.060 6.6 5.9 Row 0.38


Genetic Variation
Genetic variation refers to the variation in the genome sequences between individual organisms of a species. Individual differences or population differences can both be referred to as genetic variations. It is primarily caused by mutation, but other factors such as genetic drift and sexual reproduction also play a major role.
Quantitative Genetics
Quantitative genetics is the part of genetics that deals with the continuous trait, where the expression of various genes influences the phenotypes. Thus genes are expressed together to produce a trait with continuous variability. This is unlike the classical traits or qualitative traits, where each trait is controlled by the expression of a single or very few genes to produce a discontinuous variation.

Step by step
Solved in 3 steps


