150 Vapor 130 110 Liquid 70 50 A 100% - 80% - 60% - - 40% · 20% 0% 0% – 20% 40% 60% 80% -100% B Figure 14.3 Phase diagram for a typical liquid mixture of two components. Temperature
150 Vapor 130 110 Liquid 70 50 A 100% - 80% - 60% - - 40% · 20% 0% 0% – 20% 40% 60% 80% -100% B Figure 14.3 Phase diagram for a typical liquid mixture of two components. Temperature

Biology 2e
2nd Edition
ISBN:9781947172517
Author:Matthew Douglas, Jung Choi, Mary Ann Clark
Publisher:Matthew Douglas, Jung Choi, Mary Ann Clark
Chapter4: Cell Structure
Section: Chapter Questions
Problem 43CTQ: Pathogenic E. coil have recently been shown to degrade tight junction proteins during infection. How...

Related questions

Question
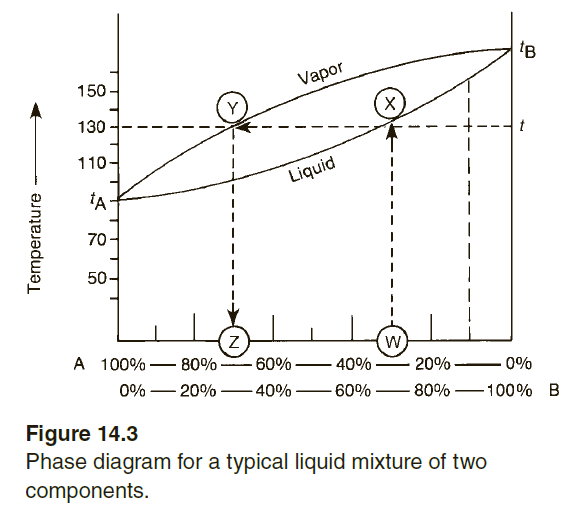
Using the figure, answer the following questions.
a. What is the molar composition of the vapor in equilibrium with a boiling
liquid that has a composition of 60% A and 40% B?
b. A sample of vapor has the composition 50% A and 50% B. What is the composition of the boiling liquid that produced this vapor?
Transcribed Image Text:150
Vapor
130
110
Liquid
70
50
A 100%
- 80% - 60% -
-
40% ·
20%
0%
0% – 20%
40%
60%
80%
-100% B
Figure 14.3
Phase diagram for a typical liquid mixture of two
components.
Temperature
Expert Solution
This question has been solved!
Explore an expertly crafted, step-by-step solution for a thorough understanding of key concepts.

This is a popular solution!

Trending now
This is a popular solution!

Step by step
Solved in 4 steps with 2 images

Knowledge Booster


Learn more about
Need a deep-dive on the concept behind this application? Look no further. Learn more about this topic, biochemistry and related others by exploring similar questions and additional content below.Recommended textbooks for you
Biology 2e
Biology
ISBN:
9781947172517
Author:
Matthew Douglas, Jung Choi, Mary Ann Clark
Publisher:
OpenStax

Biology 2e
Biology
ISBN:
9781947172517
Author:
Matthew Douglas, Jung Choi, Mary Ann Clark
Publisher:
OpenStax
Essentials of Pharmacology for Health Professions
Nursing
ISBN:
9781305441620
Author:
WOODROW
Publisher:
Cengage

Human Heredity: Principles and Issues (MindTap Co…
Biology
ISBN:
9781305251052
Author:
Michael Cummings
Publisher:
Cengage Learning