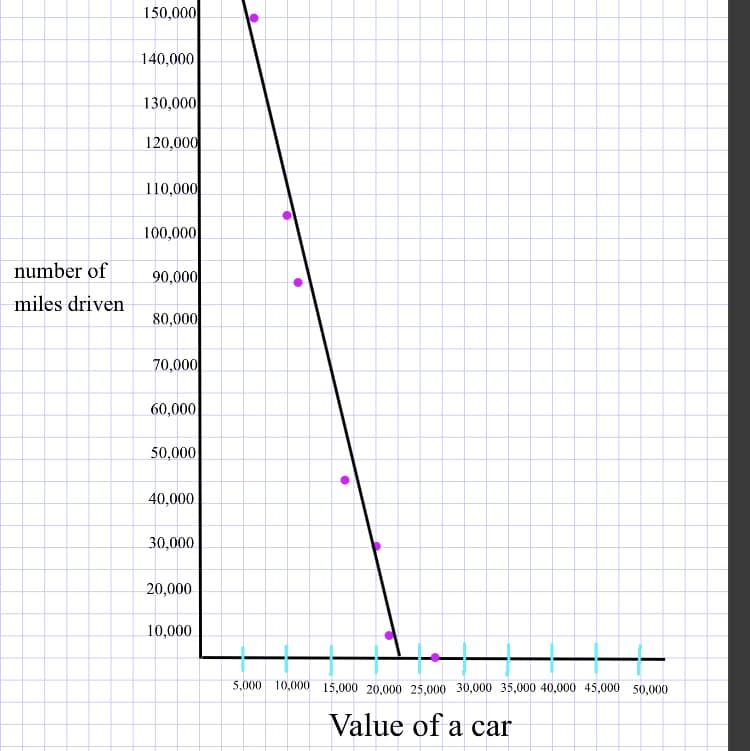
150,000 140,000 130,000 120,000 110,000 100,000 number of 90,000 miles driven 80,000 70,000 60,000 50,000 40,000 30,000 20,000 10,000 5,000 10,000 15,000 20,000 25,000 30,000 35,000 40,000 45,000 50,000 Value of a car

Glencoe Algebra 1, Student Edition, 9780079039897, 0079039898, 2018
18th Edition
ISBN:9780079039897
Author:Carter
Publisher:Carter
Chapter4: Equations Of Linear Functions
Section4.5: Correlation And Causation
Problem 15PPS
icon
Related questions
icon
Concept explainers
Topic Video
Question
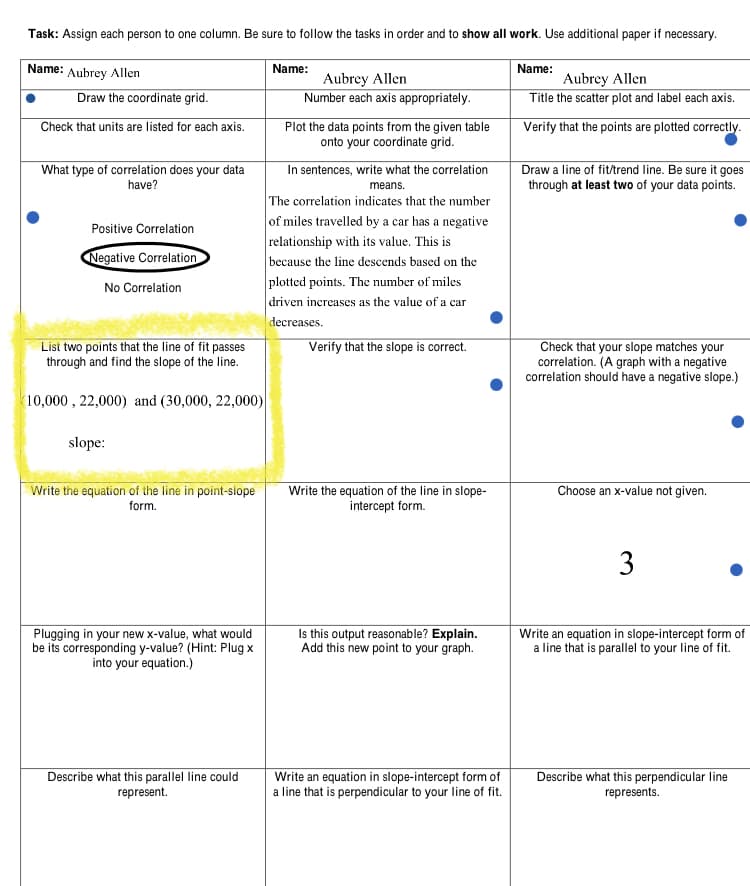
Basically I have this math assignment, in which I’m confused about. I highlighted the preferred section that I would like assistance on. But if you are able can you let me know if I got the first part of the question right. So if I listed the right two lines of fit passes through. And what is the slop of the line. I attached the assignment and the graph.
150,000
140,000
130,000
120,000
110,000
100,000
number of
90,000
miles driven
80,000
70,000
60,000
50,000
40,000
30,000
20,000
10,000
5,000
10,000 15,000 20,000 25,000 30,000 35,000 40,000 45,000 50,000
Value of a car
Transcribed Image Text:150,000 140,000 130,000 120,000 110,000 100,000 number of 90,000 miles driven 80,000 70,000 60,000 50,000 40,000 30,000 20,000 10,000 5,000 10,000 15,000 20,000 25,000 30,000 35,000 40,000 45,000 50,000 Value of a car
Task: Assign each person to one column. Be sure to follow the tasks in order and to show all work. Use additional paper if necessary.
Name: Aubrey Allen
Name:
Name:
Draw the coordinate grid.
Aubrey Allen
Number each axis appropriately.
Aubrey Allen
Title the scatter plot and label each axis.
Check that units are listed for each axis.
Plot the data points from the given table
onto your coordinate grid.
Verify that the points are plotted correctly.
What type of correlation does your data
have?
In sentences, write what the correlation
Draw a line of fit/trend line. Be sure it goes
through at least two of your data points.
means.
The correlation indicates that the number
of miles travelled by a car has a negative
relationship with its value. This is
because the line descends based on the
plotted points. The number of miles
driven increases as the value of a car
decreases.
Positive Correlation
Negative Correlation
No Correlation
Verify that the slope is correct.
List two points that the line of fit passes
through and find the slope of the line.
Check that your slope matches your
correlation. (A graph with a negative
correlation should have a negative slope.)
10,000, 22,000) and (30,000, 22,000)
slope:
Write the equation of the line in point-siope
Write the equation of the line in slope-
intercept form.
Choose an x-value not given.
form.
3
Plugging in your new x-value, what would
be its corresponding y-value? (Hint: Plug x
into your equation.)
Is this output reasonable? Explain.
Add this new point to your graph.
Write an equation in slope-intercept form of
a line that is parallel to your line of fit.
Describe what this parallel line could
represent.
Write an equation in slope-intercept form of
a line that is perpendicular to your line of fit.
Describe what this perpendicular line
represents.
Transcribed Image Text:Task: Assign each person to one column. Be sure to follow the tasks in order and to show all work. Use additional paper if necessary. Name: Aubrey Allen Name: Name: Draw the coordinate grid. Aubrey Allen Number each axis appropriately. Aubrey Allen Title the scatter plot and label each axis. Check that units are listed for each axis. Plot the data points from the given table onto your coordinate grid. Verify that the points are plotted correctly. What type of correlation does your data have? In sentences, write what the correlation Draw a line of fit/trend line. Be sure it goes through at least two of your data points. means. The correlation indicates that the number of miles travelled by a car has a negative relationship with its value. This is because the line descends based on the plotted points. The number of miles driven increases as the value of a car decreases. Positive Correlation Negative Correlation No Correlation Verify that the slope is correct. List two points that the line of fit passes through and find the slope of the line. Check that your slope matches your correlation. (A graph with a negative correlation should have a negative slope.) 10,000, 22,000) and (30,000, 22,000) slope: Write the equation of the line in point-siope Write the equation of the line in slope- intercept form. Choose an x-value not given. form. 3 Plugging in your new x-value, what would be its corresponding y-value? (Hint: Plug x into your equation.) Is this output reasonable? Explain. Add this new point to your graph. Write an equation in slope-intercept form of a line that is parallel to your line of fit. Describe what this parallel line could represent. Write an equation in slope-intercept form of a line that is perpendicular to your line of fit. Describe what this perpendicular line represents.
Expert Solution
steps

Step by step

Solved in 2 steps

Blurred answer
Knowledge Booster
Application of Algebra
Learn more about
Need a deep-dive on the concept behind this application? Look no further. Learn more about this topic, geometry and related others by exploring similar questions and additional content below.
Recommended textbooks for you
Glencoe Algebra 1, Student Edition, 9780079039897…
Algebra
ISBN:
9780079039897
Author:
Carter
Publisher:
McGraw Hill
Big Ideas Math A Bridge To Success Algebra 1: Stu…
Algebra
ISBN:
9781680331141
Author:
HOUGHTON MIFFLIN HARCOURT
Publisher:
Houghton Mifflin Harcourt
Holt Mcdougal Larson Pre-algebra: Student Edition…
Algebra
ISBN:
9780547587776
Author:
HOLT MCDOUGAL
Publisher:
HOLT MCDOUGAL
Functions and Change: A Modeling Approach to Coll…
Algebra
ISBN:
9781337111348
Author:
Bruce Crauder, Benny Evans, Alan Noell
Publisher:
Cengage Learning