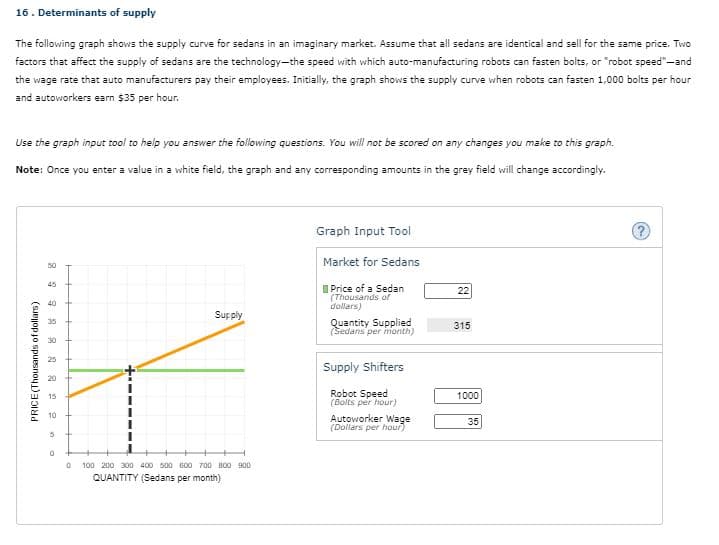
16. Determinants of supply The following graph shows the supply curve for sedans in an imaginary market. Assume that all sedans are identical and sell for the same price. Two factors that affect the supply of sedans are the technology-the speed with which auto-manufacturing robots can fasten bolts, or "robot speed"-and the wage rate that auto manufacturers pay their employees. Initially, the graph shows the supply curve when robots can fasten 1.,000 bolts per hour and autoworkers earn $35 per hour. Use the graph input tool to help you answer the following questions. You will not be scored on any changes you make to this graph. Note: Once you enter a value in a white field, the graph and any corresponding amounts in the grey field will change accordingly. Graph Input Tool Market for Sedans 50 45 I Price of a Sedan (Thousands of dollars) 22 40 Sup ply Quantity Supplied (Sedans per inionth) 35 315 30 25 Supply Shifters 20 Robot Speed (Bolts per hour) 15 1000 10 Autoworker Wage (Dollars per hour) 35 100 200 300 400 500 600 700 B00 900 QUANTITY (Sedans per month) PRICE(Thousands of dollars)
16. Determinants of supply The following graph shows the supply curve for sedans in an imaginary market. Assume that all sedans are identical and sell for the same price. Two factors that affect the supply of sedans are the technology-the speed with which auto-manufacturing robots can fasten bolts, or "robot speed"-and the wage rate that auto manufacturers pay their employees. Initially, the graph shows the supply curve when robots can fasten 1.,000 bolts per hour and autoworkers earn $35 per hour. Use the graph input tool to help you answer the following questions. You will not be scored on any changes you make to this graph. Note: Once you enter a value in a white field, the graph and any corresponding amounts in the grey field will change accordingly. Graph Input Tool Market for Sedans 50 45 I Price of a Sedan (Thousands of dollars) 22 40 Sup ply Quantity Supplied (Sedans per inionth) 35 315 30 25 Supply Shifters 20 Robot Speed (Bolts per hour) 15 1000 10 Autoworker Wage (Dollars per hour) 35 100 200 300 400 500 600 700 B00 900 QUANTITY (Sedans per month) PRICE(Thousands of dollars)

Chapter4: Supply And Demand: An Initial Look
Section: Chapter Questions
Problem 2TY

Related questions
Question
Transcribed Image Text:Robot Speed
(Bolts per hour)
1000
15
10
Autoworker Wage
(Dollars per hour)
35
100 200 300 400 s00 600 700 B00 900
QUANTITY (Sedans per month)
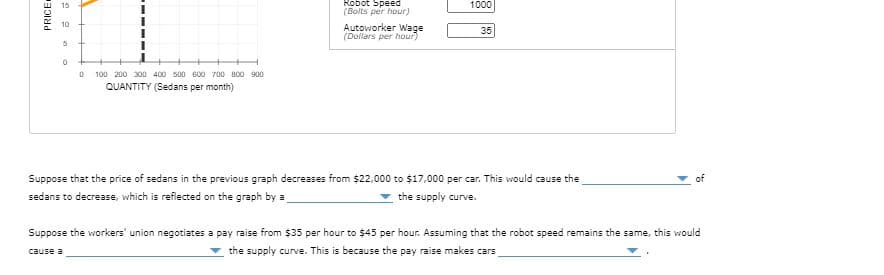
Suppose that the price of sedans in the previous graph decreases from $22,000 to $17,000 per car. This would cause the
sedans to decrease, which is reflected on the graph by a
the supply curve.
Suppose the workers' union negotiates a pay raise from $35 per hour to $45 per hour. Assuming that the robot speed remains the same, this would
cause a
the supply curve. This is because the pay raise makes cars
PRICE
Transcribed Image Text:16. Determinants of supply
The following graph shows the supply curve for sedans in an imaginary market. Assume that all sedans are identical and sell for the same price. Two
factors that affect the supply of sedans are the technology-the speed with which auto-manufacturing robots can fasten bolts, or "robot speed"-and
the wage rate that auto manufacturers pay their employees. Initially, the graph shows the supply curve when robots can fasten 1,000 bolts per hour
and autoworkers earn $35 per hour.
Use the graph input tool to help you answer the following questions. You will not be scored on any changes you make to this graph.
Note: Once you enter a value in a white field, the graph and any corresponding amounts in the grey field will change accordingly.
Graph Input Tool
Market for Sedans
50
45
I Price of a Sedan
(Thousands of
dollars)
22
40
Supply
35
Quantity Supplied
(Sedans per month)
315
30
25
Supply Shifters
20
Robot Speed
(Bolts per hour)
15
1000
10
Autoworker Wage
(Dollars per hour)
35
100 200 300 400 500 600 700 B00 900
QUANTITY (Sedans per month)
PRICE(Thousands of dollars)
Expert Solution
This question has been solved!
Explore an expertly crafted, step-by-step solution for a thorough understanding of key concepts.

This is a popular solution!

Trending now
This is a popular solution!

Step by step
Solved in 2 steps

Recommended textbooks for you

Brief Principles of Macroeconomics (MindTap Cours…
Economics
ISBN:
9781337091985
Author:
N. Gregory Mankiw
Publisher:
Cengage Learning

Essentials of Economics (MindTap Course List)
Economics
ISBN:
9781337091992
Author:
N. Gregory Mankiw
Publisher:
Cengage Learning
Brief Principles of Macroeconomics (MindTap Cours…
Economics
ISBN:
9781337091985
Author:
N. Gregory Mankiw
Publisher:
Cengage Learning
Essentials of Economics (MindTap Course List)
Economics
ISBN:
9781337091992
Author:
N. Gregory Mankiw
Publisher:
Cengage Learning

Principles of Economics 2e
Economics
ISBN:
9781947172364
Author:
Steven A. Greenlaw; David Shapiro
Publisher:
OpenStax

Principles of Economics, 7th Edition (MindTap Cou…
Economics
ISBN:
9781285165875
Author:
N. Gregory Mankiw
Publisher:
Cengage Learning

Principles of Microeconomics (MindTap Course List)
Economics
ISBN:
9781305971493
Author:
N. Gregory Mankiw
Publisher:
Cengage Learning