3. The following graph shows the supply curve for sedans in an imaginary market. For simplicity, assume that all sedans are identical and sell for the same price. Two factors that affect the supply of sedans are the level of technical knowledge – in this case, the speed with which manufacturing robots can fasten bolts, or robot speed – and the wage rate that auto manufacturers must pay their employees. Initially, the| graph shows the supply curve when robots can fasten 2,500 bolts per hour and autoworkers earn $25 per hour. Graph Input Tool Supply for Sedans 50 I Price of a Sedan (Thousands of dollars) 20 40 Supply Quantity Supplied (Sedans per month) 225 SUPPLY SHIFTERS 20 Robot Speed (Bolts per hour) 2500 Autoworker Wage (Dollars per hour) 10 25 100 200 300 400 500 600 700 800 900 QUANTITY (Sedans per month) Suppose that the price of a sedan increases from $20,000 to $25,000. This would cause the quantity supplied of sedans to (movement along or shift of) the supply curve. (decrease or increase), which is reflected on the graph by a Following a technological decline – for example, a decrease in the speed with which robots can attach bolts to cars – there is a or a leftward movement along) the supply curve because the technological decline makes cars (rightward shift of, leftward shift of, rightward movement along, (less expensive to build, more fashionable, more expensive to build or safer). PRICE (Thousands of dollars)
3. The following graph shows the supply curve for sedans in an imaginary market. For simplicity, assume that all sedans are identical and sell for the same price. Two factors that affect the supply of sedans are the level of technical knowledge – in this case, the speed with which manufacturing robots can fasten bolts, or robot speed – and the wage rate that auto manufacturers must pay their employees. Initially, the| graph shows the supply curve when robots can fasten 2,500 bolts per hour and autoworkers earn $25 per hour. Graph Input Tool Supply for Sedans 50 I Price of a Sedan (Thousands of dollars) 20 40 Supply Quantity Supplied (Sedans per month) 225 SUPPLY SHIFTERS 20 Robot Speed (Bolts per hour) 2500 Autoworker Wage (Dollars per hour) 10 25 100 200 300 400 500 600 700 800 900 QUANTITY (Sedans per month) Suppose that the price of a sedan increases from $20,000 to $25,000. This would cause the quantity supplied of sedans to (movement along or shift of) the supply curve. (decrease or increase), which is reflected on the graph by a Following a technological decline – for example, a decrease in the speed with which robots can attach bolts to cars – there is a or a leftward movement along) the supply curve because the technological decline makes cars (rightward shift of, leftward shift of, rightward movement along, (less expensive to build, more fashionable, more expensive to build or safer). PRICE (Thousands of dollars)

Chapter4: Supply And Demand: An Initial Look
Section: Chapter Questions
Problem 2TY

Related questions
Question
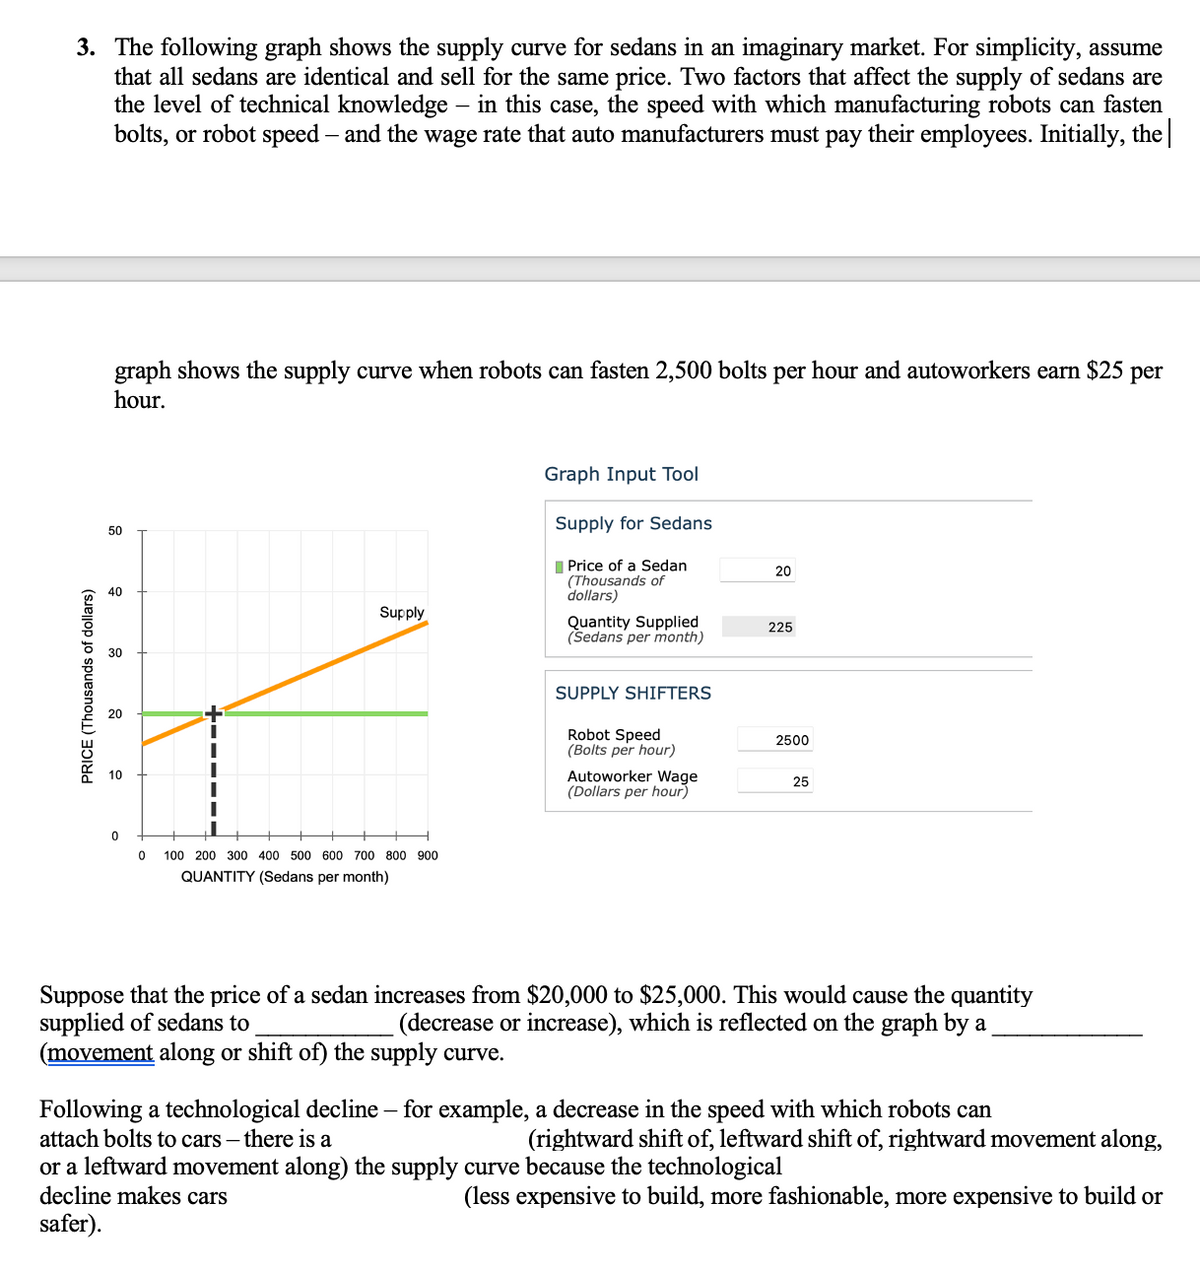
Transcribed Image Text:3. The following graph shows the supply curve for sedans in an imaginary market. For simplicity, assume
that all sedans are identical and sell for the same price. Two factors that affect the supply of sedans are
the level of technical knowledge – in this case, the speed with which manufacturing robots can fasten
bolts, or robot speed – and the wage rate that auto manufacturers must pay their employees. Initially, the
graph shows the supply curve when robots can fasten 2,500 bolts per hour and autoworkers earn $25 per
hour.
Graph Input Tool
Supply for Sedans
50
I Price of a Sedan
(Thousands of
dollars)
20
40
Supply
Quantity Supplied
(Sedans per month)
225
30
SUPPLY SHIFTERS
20
Robot Speed
(Bolts per hour)
2500
Autoworker Wage
(Dollars per hour)
10
25
100 200 300 400 500 600 700 800 900
QUANTITY (Sedans per month)
Suppose that the price of a sedan increases from $20,000 to $25,000. This would cause the quantity
supplied of sedans to
(movement along or shift of) the supply curve.
(decrease or increase), which is reflected on the graph by a
Following a technological decline – for example, a decrease in the speed with which robots can
attach bolts to cars – there is a
(rightward shift of, leftward shift of, rightward movement along,
or a leftward movement along) the supply curve because the technological
decline makes cars
(less expensive to build, more fashionable, more expensive to build or
safer).
PRICE (Thousands of dollars)
Expert Solution
This question has been solved!
Explore an expertly crafted, step-by-step solution for a thorough understanding of key concepts.

This is a popular solution!

Trending now
This is a popular solution!

Step by step
Solved in 2 steps

Recommended textbooks for you

Principles of Economics 2e
Economics
ISBN:
9781947172364
Author:
Steven A. Greenlaw; David Shapiro
Publisher:
OpenStax

Economics Today and Tomorrow, Student Edition
Economics
ISBN:
9780078747663
Author:
McGraw-Hill
Publisher:
Glencoe/McGraw-Hill School Pub Co
Principles of Economics 2e
Economics
ISBN:
9781947172364
Author:
Steven A. Greenlaw; David Shapiro
Publisher:
OpenStax
Economics Today and Tomorrow, Student Edition
Economics
ISBN:
9780078747663
Author:
McGraw-Hill
Publisher:
Glencoe/McGraw-Hill School Pub Co

Brief Principles of Macroeconomics (MindTap Cours…
Economics
ISBN:
9781337091985
Author:
N. Gregory Mankiw
Publisher:
Cengage Learning

Essentials of Economics (MindTap Course List)
Economics
ISBN:
9781337091992
Author:
N. Gregory Mankiw
Publisher:
Cengage Learning

Exploring Economics
Economics
ISBN:
9781544336329
Author:
Robert L. Sexton
Publisher:
SAGE Publications, Inc