16. In your class, majority receive high scores on this final examination. Which of the following data set illustrates this? A. В. C. D.
16. In your class, majority receive high scores on this final examination. Which of the following data set illustrates this? A. В. C. D.

Glencoe Algebra 1, Student Edition, 9780079039897, 0079039898, 2018
18th Edition
ISBN:9780079039897
Author:Carter
Publisher:Carter
Chapter10: Statistics
Section10.4: Distributions Of Data
Problem 20PFA

Related questions
Topic Video
Question
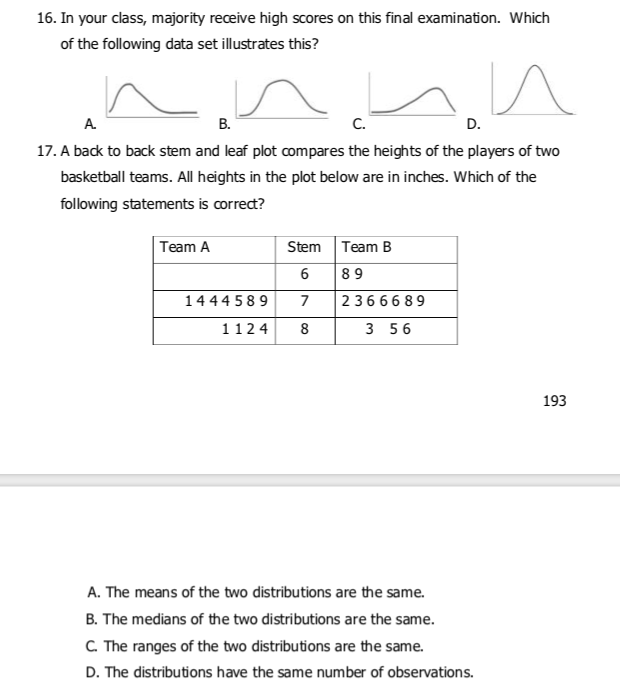
Transcribed Image Text:16. In your class, majority receive high scores on this final examination. Which
of the following data set illustrates this?
A.
В.
C.
D.
17. A back to back stem and leaf plot compares the heights of the players of two
basketball teams. All heights in the plot below are in inches. Which of the
following statements is correct?
Team A
Stem
Team B
6
89
1444 589
7
23666 89
1124
8
3 56
193
A. The means of the two distributions are the same.
B. The medians of the two distributions are the same.
C. The ranges of the two distributions are the same.
D. The distributions have the same number of observations.
Expert Solution
This question has been solved!
Explore an expertly crafted, step-by-step solution for a thorough understanding of key concepts.

Step by step
Solved in 5 steps

Knowledge Booster


Learn more about
Need a deep-dive on the concept behind this application? Look no further. Learn more about this topic, statistics and related others by exploring similar questions and additional content below.Recommended textbooks for you
Glencoe Algebra 1, Student Edition, 9780079039897…
Algebra
ISBN:
9780079039897
Author:
Carter
Publisher:
McGraw Hill
Glencoe Algebra 1, Student Edition, 9780079039897…
Algebra
ISBN:
9780079039897
Author:
Carter
Publisher:
McGraw Hill