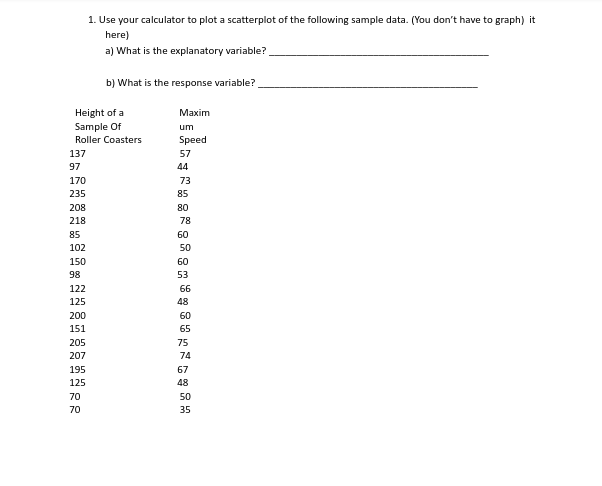
1. Use your calculator to plot a scatterplot of the following sample data. (You don't have to graph) it here) a) What is the explanatory variable?. b) What is the response variable? Height of a Sample Of Roller Coasters Мaxim um Speed 137 57 97 44 170 73 235 85 208 80 218 78 85 60 102 50 150 60 98 53 122 66 125 48 200 60 151 65 205 75 207 74 195 67 125 48 70 50 70 35


Inverse Normal Distribution
The method used for finding the corresponding z-critical value in a normal distribution using the known probability is said to be an inverse normal distribution. The inverse normal distribution is a continuous probability distribution with a family of two parameters.
Mean, Median, Mode
It is a descriptive summary of a data set. It can be defined by using some of the measures. The central tendencies do not provide information regarding individual data from the dataset. However, they give a summary of the data set. The central tendency or measure of central tendency is a central or typical value for a probability distribution.
Z-Scores
A z-score is a unit of measurement used in statistics to describe the position of a raw score in terms of its distance from the mean, measured with reference to standard deviation from the mean. Z-scores are useful in statistics because they allow comparison between two scores that belong to different normal distributions.


Trending now
This is a popular solution!

Step by step
Solved in 2 steps with 2 images


