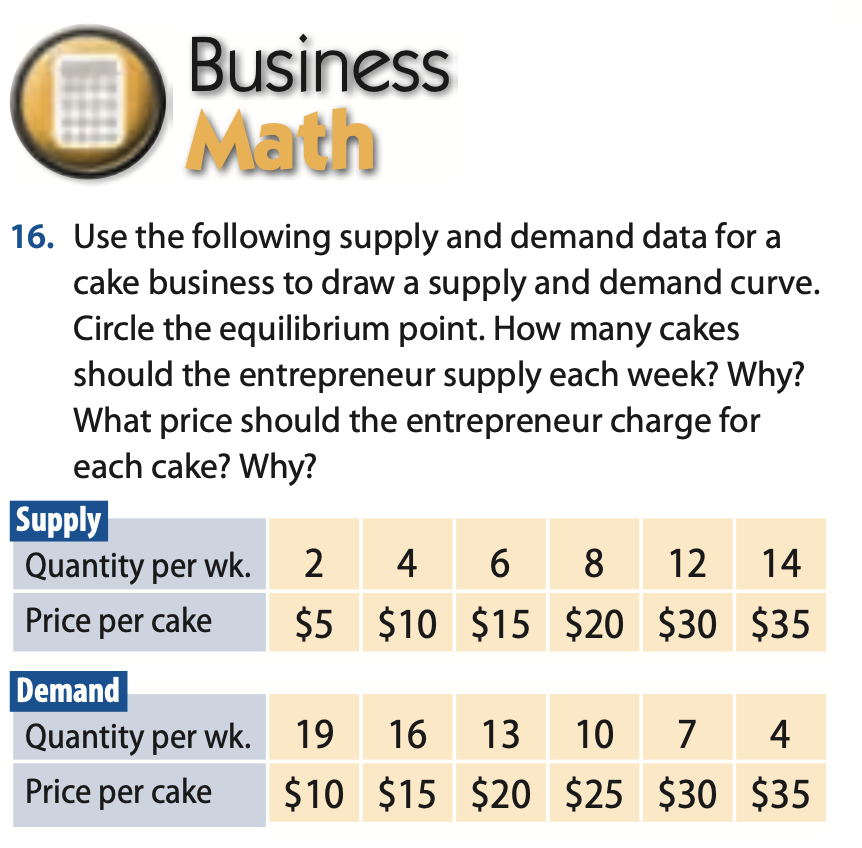
16. Use the following supply and demand data for a cake business to draw a supply and demand curve. Circle the equilibrium point. How many cakes should the entrepreneur supply each week? Why? What price should the entrepreneur charge for each cake? Why? Supply Quantity per wk. 2 4 6 8 12 14 Price per cake $5 $10 $15 $20 $30 $35 Demand Quantity per wk. 19 16 13 10 7 4 Price per cake $10 $15 $20 $25 $30 $35


Q: 5- Price 0. Quantity Figure 4 Refer to Figure 4. The graph in this figure illustrates an initial…
A: In this graph D1 and S1 are initial demand and supply curves respectively.
Q: 1- How would each of the following affect the U.S. market supply curve for corn? a. A new and…
A: Since you have asked multiple questions, we are answering the first one for you. If you want the…
Q: .Explain, four major socio-economic trends that are impacting the food service-industry today?
A: Answer - Four major socio-economic trends that impacting the food service-industry today are - 1.…
Q: 5. Draw a supply and demand curve for local fast food. A new Chick-fil-A, Chipotle, and McDonald's…
A: The demand (dd) curve shows us the inverse/negative relation between the price(P) of the fast food…
Q: PROBLEM SET 2 Supply and Demand DEMAND/SUPPLY SCHEDULE 1 DEMAND/SUPPLY…
A: 5. Change in demand/supply represent a movement along the demand/supply curve thanks to change in…
Q: Graph below depicts the market for industrial milk. Price per hectolitre ($) 42 36 30 24 18 12 6 65…
A: Here, the given graph b shows the market for milk with price in Y-axis and quantity on X-axis.
Q: 19. What could explain a decrease in demand for sugar cane? Demand for sugar has increased. New…
A: (Note: Since the question has multiple parts, the first has been solved. Please resubmit the whole…
Q: 1. Consider the outpatient clinic services in hospitals which are of competitive in nature. Analyze…
A: The markets are the place where the buyers of goods, and services meet and interact with each other.…
Q: The war on illegal drugs has increased the stream of revenue for drug cartels. Explain why this is…
A: The free market's economic dynamics of supply and demand determine what goods manufacturers are…
Q: STRAND 3 OUR ECONOMY 22. The table below shows the demand and supply schedules for Boosted Board…
A: Question 22: Price Quantity Demanded Quantity Supplied 800 25000 5000 900 20000 10000 1000…
Q: 5. Describe, and show graphically, how the bandwagon and snob effects affect the market demand curve…
A: Bandwagon and Snob effects are part of network externalities. The former is a positive externality,…
Q: Refer to the following supply curve. At a current price of $4, what is the price elasticity of…
A: Answer: Note: Elasticity of supply for the given data is 2. But 2 is not given in the option. So you…
Q: 5) The following equations represent the demand and supply curves in the competitive U.S. beef…
A: We are given: Demand function: P = 92.82 - 12.75 x - 8.25 = 84.57 - 12.57xSupply function: P = 56x…
Q: 4.. Good news for farming can be bad news for farmers because the a. supply curve for an individual…
A: The farming products that are agricultural goods are considered essential goods. This means demand…
Q: Which of the following statements is more correct if the price of a product in a perfectly…
A: Perfect Competition is defined as a market structure which is considered as the ideal type of market…
Q: 6. Suppose that the supply schedule of Maine lobsters is as follows: Price of lobster Quantity of…
A: Below is the table:
Q: If the demand decreases at all prices, what will happen to the demand curve? Show the shift in the…
A: The amount of people willing to pay a specific price for products or services is known as economic…
Q: 16. The post office sells postage stamps for $ .55 each. The daily demand for these stamps is given…
A: The total revenue (TR) of a firm can be calculated by simply multiplying the total level of quantity…
Q: 1. Consider the following demand and supply model of the world tea market (in billions of pounds)…
A: Note: We’ll answer the first question since the exact one wasn’t specified. Please submit a new…
Q: 3. Effects of rent control Rent controls force landlords to price apartments below the equilibrium…
A: Rent is referred as the factor payment for the use of the house by an individuals in an economy. The…
Q: Imagine that you lease an apartment for $900 a month. The market price for that apartment has…
A: Equilibrium Price Equilibrium price refers to a price level at which market demand is equal to the…
Q: 3. The supply and demand schedules below describe the market for compact fluorescent lightbulbs…
A: The equilibrium is where the demand and supply intersects, i.e. the point where both forces are…
Q: 5. Demand and Supply - Begin each question with a graph showing the following: the market clears at…
A: “Since you have posted a question with multiple sub-parts, we will solve first three subparts for…
Q: Suppose that the price of basketball tickets at the college is determined by market forces.…
A: Dear student, you have asked multiple sub-part questions in a single post. In such a case, I will be…
Q: 3. The supply and demand schedules below describe the market for compact fluorescent lightbulbs…
A: The Market is in equilibrium at a price where market demand for a commodity is equal to its supply.…
Q: 19. What could explain a decrease in demand for sugar cane? Demand for sugar has increased. New…
A: Hello. Since your question has multiple parts, we will solve the first question for you. If you want…
Q: Given the following demand and supply schedules for banana, you solve for the following problems.…
A: Price elasticity of demand is defined as the percentage change in quantity demanded due to a…
Q: 3. Effects of rent control Rent controls force landlords to price apartments below the equilibrium…
A: Rent control is the price ceiling that sets the maximum rent that can be charged. It is imposed to…
Q: 1.) What is meant by supply? 2.) What is the difference between a movement along the supply curve…
A: Since you have posted a question with multiple sub-parts, we will solve the first three subparts for…
Q: Refer to Figure 3.6, page 55. Assume that the graph depicts the U.S. domestic market for corn. How…
A: International trade or the export and import of goods and services are also dependent on the demand…
Q: 3. Knowing that the demand for wheat is inelastic, if all famers voluntarily did not plant wheat on…
A: Dear Student, as you have posted multiple questions in a single picture, but according to the…
Q: 12. When a producer moves down on the supply curve, it is called ______. a. Increase of supply b.…
A: 12. When a producer moves down on the supply curve, it is called - b. Decrease of supply
Q: Demand: Q = 16 - Pr Farm Supply: Q = 2 + .5Pf Marketing cost per unit: $5 Draw a graph of the…
A:
Q: $20 Supply $18 $16 $14 $12 $10 $8 $6 Demand $4 $2 $0 100 200 300 400 500 600 700 800 Quantity If the…
A: At Equilibrium Price, quantity demanded is equal to quantity supplied. Shortage occurs when…
Q: on decreases due to unknown goat diseases. What would happen to the market of salad items?
A: The buyers would tend to demand less of an economic good at higher levels of price as per the law of…
Q: 3. From the following equations, determine the price and quantity where the company's supply begins…
A: The expenditure incurred by a producer in acquiring the inputs which are used to manufacture a…
Q: Using the concepts of demand and supply, explain why cannabis prices declined sharply by 70% in…
A: There was a black market for cannabis before it's legalization. Black market emerges when the demand…
Q: Qustion 15: Suppose that we are considering the market for a good that is a Giffen Good. We are…
A: Giffen goods where price and quantity demanded is positively related to each other. If price…
Q: Price Supply $ 300.00 $ 275.00 $ 250.00 $ 225.00 $ 200.00 $ 175.00 $ 150.00 $ 125.00 $ 100.00 $…
A: Given: New price P2=$200 Old Price P1=$225 New quantity Q2=300 Old quantity Q1=350
Q: Given that the U.S. government mandates the use of ethanol as a partial substitute for gasoline (10%…
A: Demand refers the total amount of goods and services that are willing and able to buy at the…
Q: 6. Graph the demand and supply curve. Mark Z the equilibrium point and explain Price 0 5 10…
A: The supply (SS) curve represents the maximum quantity (Q) that a seller is willing to sell at a…
Q: 9 Consider the regional supply curve of farmers who produce a particular crop. a. What does the…
A: a. At the time of harvesting, the crop means the supply is available now so the quantity of crops…


Trending now
This is a popular solution!

Step by step
Solved in 2 steps with 1 images


- Suppose the demand and supply curves are described byMC = 1.11 + 0.89QWTP = 8.92 - 0.83QSuppose the price is 6.37.A. Given the price above, is there a shortage or a surplus? Surplus Shortage B. What is the value of the shortage or surplus? Only enter a positive number.I need help with econ multiple hw questions asap! 106) A firm’s demand for a factor of production is linked to its decision to supply a good in the market. What do we call this type of demand? A. secondary demand B. derived demand C. differentiated demand D. hybrid demand-supply 105) A firm’s demand for a factor of production is linked to its decision to supply a good in the market. What do we call this type of demand? A. secondary demand B. derived demand C. differentiated demand D. hybrid demand-supply12 . Problems and Applications Q10 A market is described by the following supply and demand curves: QSQS = = 3P3P QDQD = = 400−P400−P The equilibrium price is and the equilibrium quantity is . Suppose the government imposes a price ceiling of $80. This price ceiling is , and the market price will be . The quantity supplied will be , and the quantity demanded will be . Therefore, a price ceiling of $80 will result in . Suppose the government imposes a price floor of $80. This price floor is , and the market price will be . The quantity supplied will be and the quantity demanded will be . Therefore, a price floor of $80 will result in . Instead of a price control, the government levies a tax on producers of $40. As a result, the new supply curve is: QSQS = = 3(P−40)3P−40 With this tax, the market price will be , the quantity supplied will be , and the quantity demanded will be . The passage…
- How do technologies affect changes in both supply and demand? Cite an example. Do you agree that government intervention in the market can overcome market failure? Explain your answer and cite examples. PRICE ELASTICITY: Given the quantity demanded and price for chicken, compute and determine if the elasticity of the commodity and the decision of the firm. POINT PRICE QUANTITY DEMANDED FOR CHICKEN A 100 10 B 90 20 INCOME ELASTICITY: Given the quantity demanded and price for chicken, compute and determine if the elasticity of the commodity and the decision of the firm. POINT INCOME QUANTITY DEMANDED FOR CHICKEN IN KILO A 20,000 8 B 25,000 10 CROSS ELASTICITY: Given the quantity demanded and prices for commodities below, compute and determine if the goods are either substitutes or complements. GOOD QD1 QD2 P1 P2 COFFEE 4 7 8 6 TEA 5 3 7 9 GOOD QD1 QD2 P1 P2 JUICE 8 9 10 11 SOFTDRINK 6 7 9 12Note that parts f) and g) do not depend on the other parts and could be completed before or after parts a) to e). Two different boutique wineries supply two towns: town A and town B. Winery 1 supplies town A and Winery 2 supplies town B. Both wineries have a constant marginal cost c = 20. Assume that consumers are indifferent between the wines from different wineries and that they purchase wine only in the town they live. Demand for wine in town A is given by pA=40−12qA; the demand for wine in town B is given by pB=70−qB. f) For parts f) & g) only, please assume that the total demand for wine (from both towns) is given by p = 125 - Q. Assume now that due to the new government regulation, the companies broke up and went back to operating as Wineries 1 and 2. Each winery can now supply both towns and still has a marginal cost of 20. If Wineries 1 and 2 decide how much wine to produce simultaneously, what is the equilibrium price, quantity sold and profit of each winery? g) For…The value of a price-distorting subsidy for a three-bedroom apartment is $100 per month. This means that the person choosing to live in an apartment of that size would have to pay an extra $100 per month at the market rent. Then it follows that: A.that person would be just as well off if she received a cash subsidy of less than $100 per month. B.that person would be better off if she received a cash subsidy of $100 per month. C.that person would be better off if she received a cash subsidy of $100 per month, or that person would be just as well off if she received a cash subsidy of less than $100 per month D.that person would be worse off if she received a cash subsidy of $100 per month.
- 35-37. The market for widgets has the following supply and demand curves: Supply: P = 10 + (1/3)Q Demand: P = 100 – (1/2)Q Initially, the market is in equilibrium at P = $46, Q = 108. Questions 35 through 37 concern this market. 35. Suppose the government opens the border to free trade in widgets and foreign suppliers have a perfectly elastic supply at a price of $40 per unit. As a result the dollar value of widget imports is: A) $0 B) $40 C) $3600 D) $4800 E) $1380 F) $1200 G) $5520 H) $4140 I) $2400 J) none of the above 36. As a result of trade (rounded to the nearest dollar) the gain to society has changed by: A) -$684 B) +$684 C) -$594 D) +$594 E) -$90 F) +$90 G) -$1278 H) +$1278 I) $0 J) None of the above 37. Suppose a new study comes out that identifies widgets as a source of a health hazard, exposure to them causes cancer. The study estimates that the total global external cost of widget production and consumption is given by the following expression: Now determine (rounded to…The supply and demand for concert tickets are given in the table below.Price (R)0481216202428323640Quantity Demanded15141312111098765Quantity Supplied0000013579114.1.1. Plot the supply and demand curves to scale and establish the equilibrium price and quantity. 4.1.2. What is the excess supply or demand (as applicable) when price is R24? And when price is R36? 4.1.3. Describe the market adjustments in price induced by these two prices. 4.1.4. The functions underlying the example in the table are linear and can be presented as P = 18+2Q (supply) and P = 60−4Q (demand). Solve the two equations for the equilibrium price and quantity values. 4.2. Briefly explain how each of the following affects the demand for goods and services in a market place and highlight the effects on price and the equilibrium position.4.2.1. Price of the product or service 4.2.2. Price of related goods; 4.2.3. Income of consumers; 4.2.4. Number of consumers;Chapter 2 Problem #5. Suppose the demand and supplycurves for a product are given by QD= 500 −2PQS=−100 + 3Pa. Graph the supply and demand curves.b. Find the equilibrium price and quantity.Qd= Q3500-2P= -100+3PP= Pe = 120 & Qe=260The equilibrium price is $120 and the quantity is 260c. If the current price of the product is $100, what is thequantity supplied and the quantity demanded? How would you describe thissituation, and what would you expect to happen in this market?d. If the current price of the product is $150, what is thequantity supplied and the quantity demanded? How would you describe thissituation, and what would you expect to happen in this market?e. Suppose that demand changes to QD= 600 – 2P.Find the new equilibrium price and quantity, and show this on your graph.***PLEASE SHOW ALL EQUATIONS AND METHODS,
- indicate whether you think the statement is true or false andexplain why. 9. Natural gas and coal are two fuels used for electricity generation and their cross-price elasticity is positive.10. A tax on gasoline will have a smaller deadweight loss if the demand for gas is inelasticthan if it is elastic.11. If the solar panel industry is competitive, the marginal firm makes zero profits in the longrun.12. The supply of goods depends on the vertical aggregation of individual demands.13. Applying dynamic efficiency to non-depletable renewable energy is not necessary becauseits quantity will not in the future.14. Given a competitive oil market and zero extraction cost, dynamic efficiency entails that thecurrent oil price equals the present discounted value of the future price.Question 8888 The alternative policy is to introduce a tax of $3,000 on the sale of newcars. Under this policy, determine the price paid by consumers, the price received byfirms, and the number of new cars sold. Finally, determine what share of the tax ispaid for my consumers and what share is paid for by firms. Remember that we can simulate a tax by shifting the supply curve vertically by the amount of the tax. Full explain this question and text typing work only thanksSuppose the government of the island has decided to give consumers a more attractive price for tomatoes by imposing a fixed, per unit subsidy. Thus, start with the original demand (Qd = 450 - 100P) and supply (Qs = 50P) and analyze this new intervention, the subsidy. The subsidy works like this: each tomato seller receives a 3-dollar refund for each kilogram of tomatoes sold. Write down the equation for the new "effective supply" curve. Determine the new equilibrium quantity and equilibrium price. What is the price that the consumers will pay for their tomatoes? What is the price that the producers will effectively earn for their tomatoes, inclusive of the subsidy? How much will the government spend on tomato subsidies in this case in total? (Recall the units of measurement: P is the price in dollars per kilogram of tomatoes; and Q is the quantity of tomatoes, expressed in thousands of kilograms.) Graphically depict the new equilibrium complete with (solved) values for the new…