16.10 Retaking the SAT. In Exercise 16.2 (page 377), we saw that an SRS of 400 high school seniors gained an average of x = 9 points in their second attempt at the SAT Mathematics exam. Assuming that the change in score has a Nor- mal distribution with standard deviation o = dence interval for the mean change in score u in the population of all high 40, we computed a 95% confi- school seniors. (a) Find a 90% confidence interval for u based on this sample. (b) What is the margin of error for 90%? How does decreasing the confi- dence level change the margin of error of a confidence interval when the sample size and population standard deviation remain the same?
16.10 Retaking the SAT. In Exercise 16.2 (page 377), we saw that an SRS of 400 high school seniors gained an average of x = 9 points in their second attempt at the SAT Mathematics exam. Assuming that the change in score has a Nor- mal distribution with standard deviation o = dence interval for the mean change in score u in the population of all high 40, we computed a 95% confi- school seniors. (a) Find a 90% confidence interval for u based on this sample. (b) What is the margin of error for 90%? How does decreasing the confi- dence level change the margin of error of a confidence interval when the sample size and population standard deviation remain the same?

MATLAB: An Introduction with Applications
6th Edition
ISBN:9781119256830
Author:Amos Gilat
Publisher:Amos Gilat
Chapter1: Starting With Matlab
Section: Chapter Questions
Problem 1P

Related questions
Question
needs to be solved with calculator please ti 83 or 84
Transcribed Image Text:Ruler
EOne Page
CL View Side by Side
Gridlines
EE Multiple Pages
ID Synchronous Scrolling
Focus ImmeIsive
Reader
Side
Zoom 100%
New Arrange Split
Switch
Windows
to Side
Navigation Pane
Page Width
Window
All
Reset Window Position
Immersive
Page Movement
Show
Zoom
Window
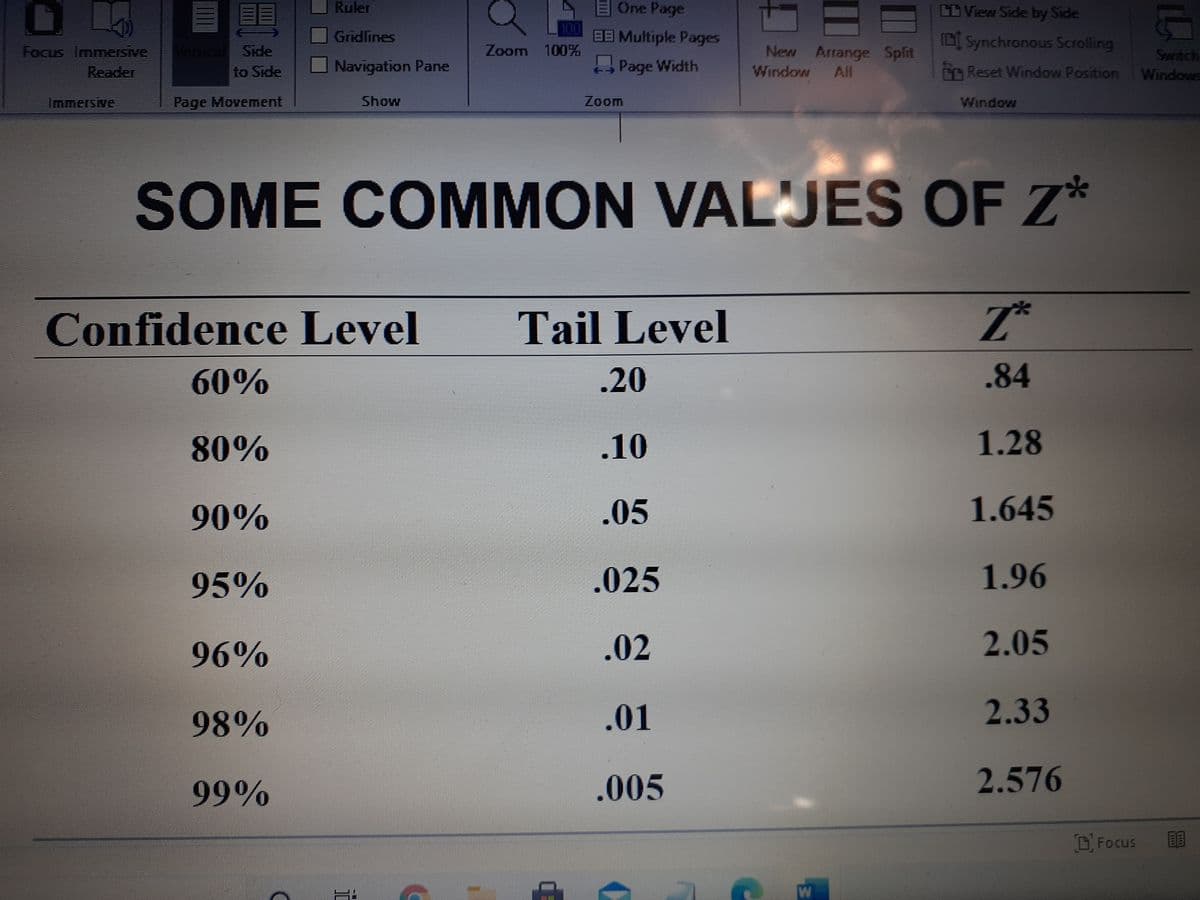
SOME COMMON VALJJES OF Z*
Confidence Level
Tail Level
60%
.20
.84
80%
.10
1.28
90%
.05
1.645
95%
.025
1.96
96%
.02
2.05
98%
.01
2.33
99%
.005
2.576
Focus
W
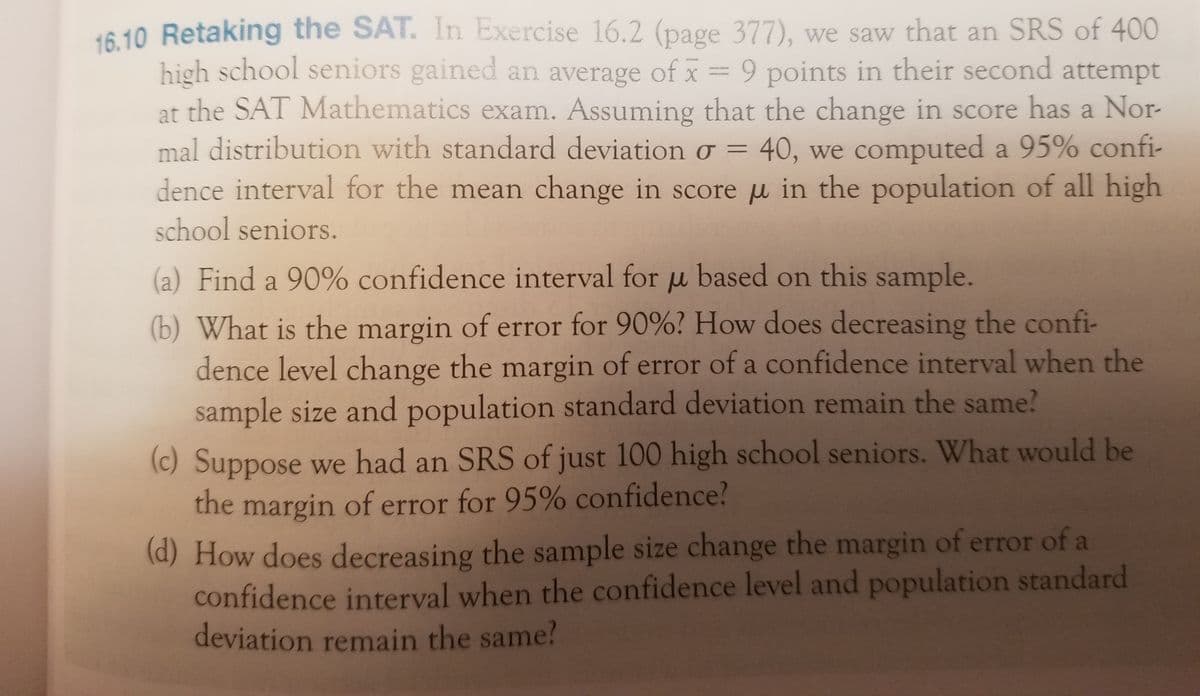
Transcribed Image Text:16.10 Retaking the SAT. In Exercise 16.2 (page 377), we saw that an SRS of 400
high school seniors gained an average of x = 9 points in their second attempt
at the SAT Mathematics exam. Assuming that the change in score has a Nor-
mal distribution with standard deviation o = 40, we computed a 95% confi-
dence interval for the mean change in score u in the population of all high
school seniors.
(a) Find a 90% confidence interval for u based on this sample.
(b) What is the margin of error for 90%? How does decreasing the confi-
dence level change the margin of error of a confidence interval when the
sample size and population standard deviation remain the same?
(c) Suppose we had an SRS of just 100 high school seniors. What would be
the margin of error for 95% confidence?
(d) How does decreasing the sample size change the margin of error of a
confidence interval when the confidence level and population standard
deviation remain the same?
Expert Solution
This question has been solved!
Explore an expertly crafted, step-by-step solution for a thorough understanding of key concepts.

This is a popular solution!

Trending now
This is a popular solution!

Step by step
Solved in 3 steps with 7 images

Knowledge Booster


Learn more about
Need a deep-dive on the concept behind this application? Look no further. Learn more about this topic, statistics and related others by exploring similar questions and additional content below.Recommended textbooks for you
MATLAB: An Introduction with Applications
Statistics
ISBN:
9781119256830
Author:
Amos Gilat
Publisher:
John Wiley & Sons Inc

Probability and Statistics for Engineering and th…
Statistics
ISBN:
9781305251809
Author:
Jay L. Devore
Publisher:
Cengage Learning

Statistics for The Behavioral Sciences (MindTap C…
Statistics
ISBN:
9781305504912
Author:
Frederick J Gravetter, Larry B. Wallnau
Publisher:
Cengage Learning
MATLAB: An Introduction with Applications
Statistics
ISBN:
9781119256830
Author:
Amos Gilat
Publisher:
John Wiley & Sons Inc
Probability and Statistics for Engineering and th…
Statistics
ISBN:
9781305251809
Author:
Jay L. Devore
Publisher:
Cengage Learning
Statistics for The Behavioral Sciences (MindTap C…
Statistics
ISBN:
9781305504912
Author:
Frederick J Gravetter, Larry B. Wallnau
Publisher:
Cengage Learning

Elementary Statistics: Picturing the World (7th E…
Statistics
ISBN:
9780134683416
Author:
Ron Larson, Betsy Farber
Publisher:
PEARSON

The Basic Practice of Statistics
Statistics
ISBN:
9781319042578
Author:
David S. Moore, William I. Notz, Michael A. Fligner
Publisher:
W. H. Freeman

Introduction to the Practice of Statistics
Statistics
ISBN:
9781319013387
Author:
David S. Moore, George P. McCabe, Bruce A. Craig
Publisher:
W. H. Freeman