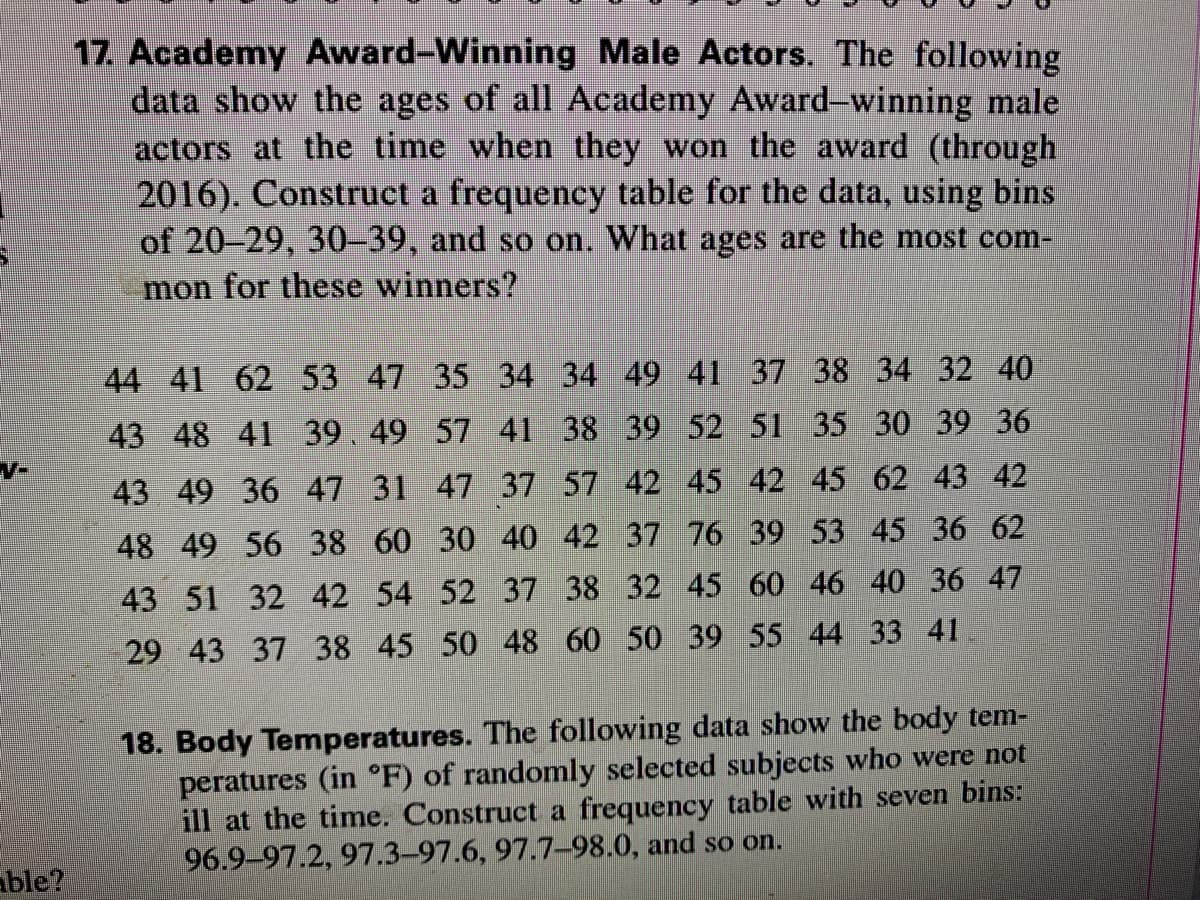
17. Academy Award-Winning Male Actors. The following data show the ages of all Academy Award-winning male actors at the time when they won the award (through 2016). Construct a frequency table for the data, using bins of 20-29, 30-39, and so on. What ages are the most com- mon for these winners? 44 41 62 53 47 35 34 34 49 41 37 38 34 32 40 43 48 41 39.49 57 41 38 39 52 51 35 30 39 36 43 49 36 47 31 47 37 57 42 45 42 45 62 43 42 48 49 56 38 60 30 40 42 37 76 39 53 45 36 62 43 51 32 42 54 52 37 38 32 45 60 46 40 36 47 29 43 37 38 45 50 48 60 50 39 55 44 33 41
17. Academy Award-Winning Male Actors. The following data show the ages of all Academy Award-winning male actors at the time when they won the award (through 2016). Construct a frequency table for the data, using bins of 20-29, 30-39, and so on. What ages are the most com- mon for these winners? 44 41 62 53 47 35 34 34 49 41 37 38 34 32 40 43 48 41 39.49 57 41 38 39 52 51 35 30 39 36 43 49 36 47 31 47 37 57 42 45 42 45 62 43 42 48 49 56 38 60 30 40 42 37 76 39 53 45 36 62 43 51 32 42 54 52 37 38 32 45 60 46 40 36 47 29 43 37 38 45 50 48 60 50 39 55 44 33 41

Glencoe Algebra 1, Student Edition, 9780079039897, 0079039898, 2018
18th Edition
ISBN:9780079039897
Author:Carter
Publisher:Carter
Chapter10: Statistics
Section: Chapter Questions
Problem 27SGR

Related questions

Question
100%
I really need help with making a corresponding histogram for number 17
Transcribed Image Text:17. Academy Award-Winning Male Actors. The following
data show the ages of all Academy Award-winning male
actors at the time when they won the award (through
2016). Construct a frequency table for the data, using bins
of 20-29, 30-39, and so on. What ages are the most com-
mon for these winners?
44 41 62 53 47 35 34 34 49 41 37 38 34 32 40
43 48 41 39.49 57 41 38 39 52 51 35 30 39 36
43 49 36 47 31 47 37 57 42 45 42 45 62 43 42
48 49 56 38 60 30 40 42 37 76 39 53 45 36 62
43 51 32 42 54 52 37 38 32 45 60 46 40 36 47
29 43 37 38 45 50 48 60 50 39 55 44 33 41
18. Body Temperatures. The following data show the body tem-
peratures (in °F) of randomly selected subjects who were not
ill at the time. Construct a frequency table with seven bins:
96.9-97.2, 97.3–97.6, 97.7-98.0, and so on.
able?
Transcribed Image Text:12. Colors. The colors of cars involved in fatal crashes last year
13. 1Q Scores. IQ scores of 1000 adults randomly selected last year
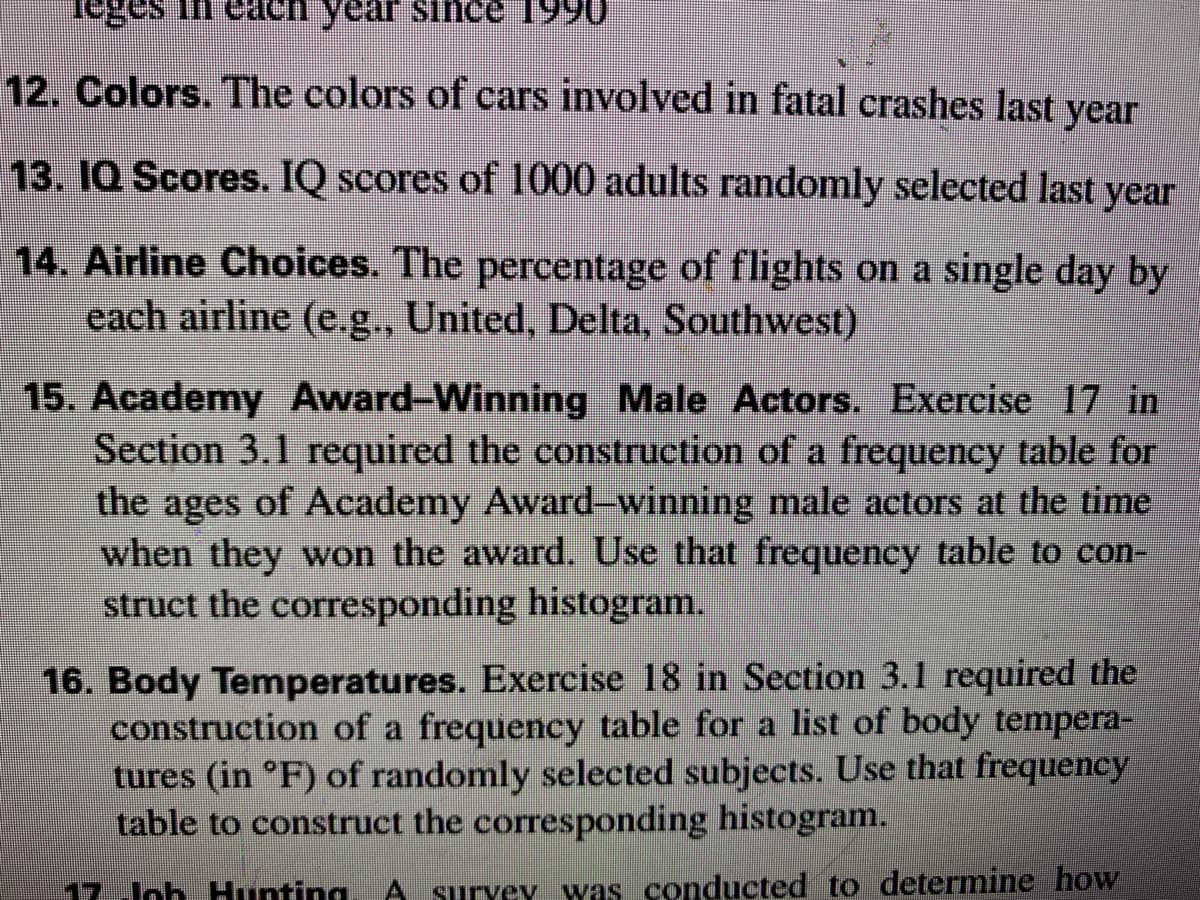
14. Airline Choices. The percentage of flights on a single day by
each airline (e.g., United, Delta, Southwest)
15. Academy Award-Winning Male Actors. Exercise 17 in
Section 3.1 required the construction of a frequency table for
the
ages of Academy Award-winning male actors at the time
when they won the award. Use that frequency table to con-
struct the corresponding histogram.
16. Body Temperatures. Exercise 18 in Section 3.1 required the
construction of a frequency table for a list of body tempera-
tures (in °F) of randomly selected subjects. Use that frequency
table to construct the corresponding histogram.
17.Jch. Hunting
A suryey was conducted to determine how
Expert Solution
This question has been solved!
Explore an expertly crafted, step-by-step solution for a thorough understanding of key concepts.

This is a popular solution!

Trending now
This is a popular solution!

Step by step
Solved in 2 steps with 1 images

Knowledge Booster


Learn more about
Need a deep-dive on the concept behind this application? Look no further. Learn more about this topic, statistics and related others by exploring similar questions and additional content below.Recommended textbooks for you
Glencoe Algebra 1, Student Edition, 9780079039897…
Algebra
ISBN:
9780079039897
Author:
Carter
Publisher:
McGraw Hill
Glencoe Algebra 1, Student Edition, 9780079039897…
Algebra
ISBN:
9780079039897
Author:
Carter
Publisher:
McGraw Hill