A social psychologist is interested in finding out whether people who self-identify as shy are more likely to attend certain types of colleges. He surveys college-bound graduating seniors and asks them what type of college they plan to attend and whether or not they consider themselves shy. The following frequency distribution table summarizes the responses to the two survey questions. College Type Agricultural, Technical, or Specialized College Liberal Arts Four-Year Community or College University Junior College Other Total Not 73 155 82 582 18 910 Shy Shy 35 24 239 41 346 Total 108 179 89 821 59 1,256 The following questions walk you through the steps of a test of the null hypothesis that a student's choice of college type is independent of whether he self-identifies as shy. Fill in the three missing values in the frequency distribution table. If a student's choice of college type is independent of whether he self-identifies as shy, then the expected frequency for the Shy/Four-Year University category is When you calculate the chi-square test statistic, you add up the contributions from each of the 10 categories. Each contribution consists of the squared difference between the expected and observed frequencies for that particular category, divided by the expected frequency-that is, (fo - fe )2 / fe. The contribution of the Shy/Four-Year University category is The work of computing the contributions of each of the remaining nine categories has been done for you. The other nine categories combined contribute 76.505 to the chi-square test statistic. The value of the test statistic is therefore y2 = 89.497 ▼
A social psychologist is interested in finding out whether people who self-identify as shy are more likely to attend certain types of colleges. He surveys college-bound graduating seniors and asks them what type of college they plan to attend and whether or not they consider themselves shy. The following frequency distribution table summarizes the responses to the two survey questions. College Type Agricultural, Technical, or Specialized College Liberal Arts Four-Year Community or College University Junior College Other Total Not 73 155 82 582 18 910 Shy Shy 35 24 239 41 346 Total 108 179 89 821 59 1,256 The following questions walk you through the steps of a test of the null hypothesis that a student's choice of college type is independent of whether he self-identifies as shy. Fill in the three missing values in the frequency distribution table. If a student's choice of college type is independent of whether he self-identifies as shy, then the expected frequency for the Shy/Four-Year University category is When you calculate the chi-square test statistic, you add up the contributions from each of the 10 categories. Each contribution consists of the squared difference between the expected and observed frequencies for that particular category, divided by the expected frequency-that is, (fo - fe )2 / fe. The contribution of the Shy/Four-Year University category is The work of computing the contributions of each of the remaining nine categories has been done for you. The other nine categories combined contribute 76.505 to the chi-square test statistic. The value of the test statistic is therefore y2 = 89.497 ▼

Glencoe Algebra 1, Student Edition, 9780079039897, 0079039898, 2018
18th Edition
ISBN:9780079039897
Author:Carter
Publisher:Carter
Chapter10: Statistics
Section: Chapter Questions
Problem 13PT

Related questions
Question
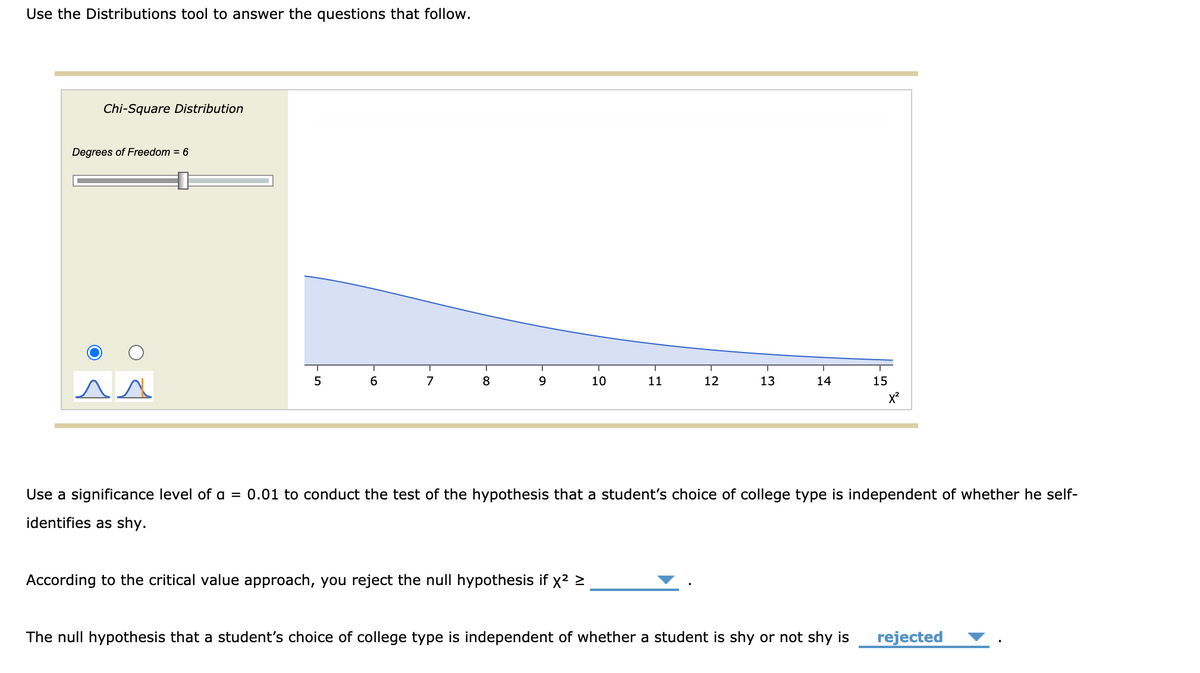
Transcribed Image Text:Use the Distributions tool to answer the questions that follow.
Chi-Square Distribution
Degrees of Freedom = 6
5
6
7
8
9
10
11
12
13
14
15
Use a significance level of a = 0.01 to conduct the test of the hypothesis that a student's choice of college type is independent of whether he self-
identifies as shy.
According to the critical value approach, you reject the null hypothesis if x2 >
The null hypothesis that a student's choice of college type is independent of whether a student is shy or not shy is
rejected
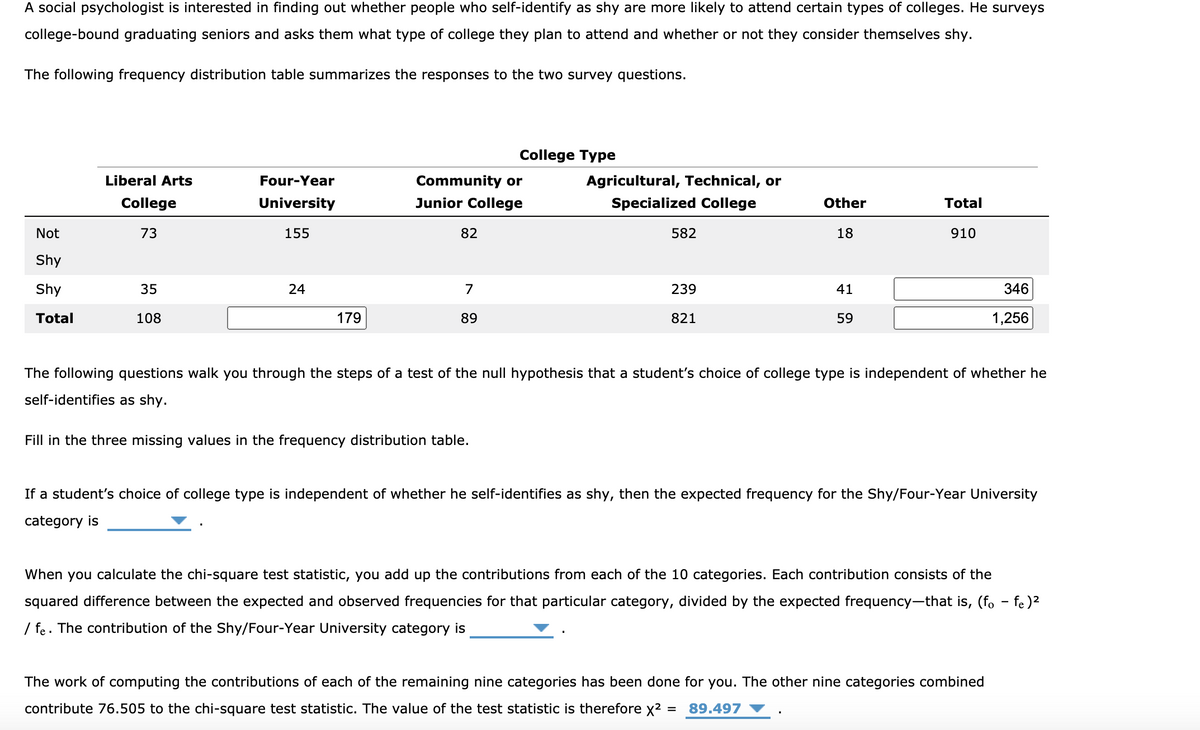
Transcribed Image Text:A social psychologist is interested in finding out whether people who self-identify as shy are more likely to attend certain types of colleges. He surveys
college-bound graduating seniors and asks them what type of college they plan to attend and whether or not they consider themselves shy.
The following frequency distribution table summarizes the responses to the two survey questions.
College Type
Liberal Arts
Community or
Junior College
Four-Year
Agricultural, Technical, or
College
University
Specialized College
Other
Total
Not
73
155
82
582
18
910
Shy
Shy
35
24
7
239
41
346
Total
108
179
89
821
59
1,256
The following questions walk you through the steps of a test of the null hypothesis that a student's choice of college type is independent of whether he
self-identifies as shy.
Fill in the three missing values in the frequency distribution table.
If a student's choice of college type is independent of whether he self-identifies as shy, then the expected frequency for the Shy/Four-Year University
category is
When you calculate the chi-square test statistic, you add up the contributions from each of the 10 categories. Each contribution consists of the
squared difference between the expected and observed frequencies for that particular category, divided by the expected frequency-that is, (fo - fe)2
/ fe. The contribution of the Shy/Four-Year University category is
The work of computing the contributions of each of the remaining nine categories has been done for you. The other nine categories combined
contribute 76.505 to the chi-square test statistic. The value of the test statistic is therefore x2 =
89.497
Expert Solution
This question has been solved!
Explore an expertly crafted, step-by-step solution for a thorough understanding of key concepts.

This is a popular solution!

Trending now
This is a popular solution!

Step by step
Solved in 5 steps

Knowledge Booster


Learn more about
Need a deep-dive on the concept behind this application? Look no further. Learn more about this topic, statistics and related others by exploring similar questions and additional content below.Recommended textbooks for you
Glencoe Algebra 1, Student Edition, 9780079039897…
Algebra
ISBN:
9780079039897
Author:
Carter
Publisher:
McGraw Hill
Glencoe Algebra 1, Student Edition, 9780079039897…
Algebra
ISBN:
9780079039897
Author:
Carter
Publisher:
McGraw Hill