18. When comparing two population means, their hypothesized difference A. must be negative B. must be positive C. must be zero D. may assume any value Answer: 19. Given the augmented Phillips model: y = Bo + B1x1 + B2x2 + ɛ, where y = actual rate of inflation (%), x1 = unemployment rate (%), and x2 = anticipated inflation rate (%). The explanatory variable or variables in this model is (are) the A. unemployment rate B. actual inflation rate C. anticipated inflation rate D. unemployment rate and anticipated inflation rate
18. When comparing two population means, their hypothesized difference A. must be negative B. must be positive C. must be zero D. may assume any value Answer: 19. Given the augmented Phillips model: y = Bo + B1x1 + B2x2 + ɛ, where y = actual rate of inflation (%), x1 = unemployment rate (%), and x2 = anticipated inflation rate (%). The explanatory variable or variables in this model is (are) the A. unemployment rate B. actual inflation rate C. anticipated inflation rate D. unemployment rate and anticipated inflation rate

Linear Algebra: A Modern Introduction
4th Edition
ISBN:9781285463247
Author:David Poole
Publisher:David Poole
Chapter2: Systems Of Linear Equations
Section2.4: Applications
Problem 28EQ

Related questions
Question
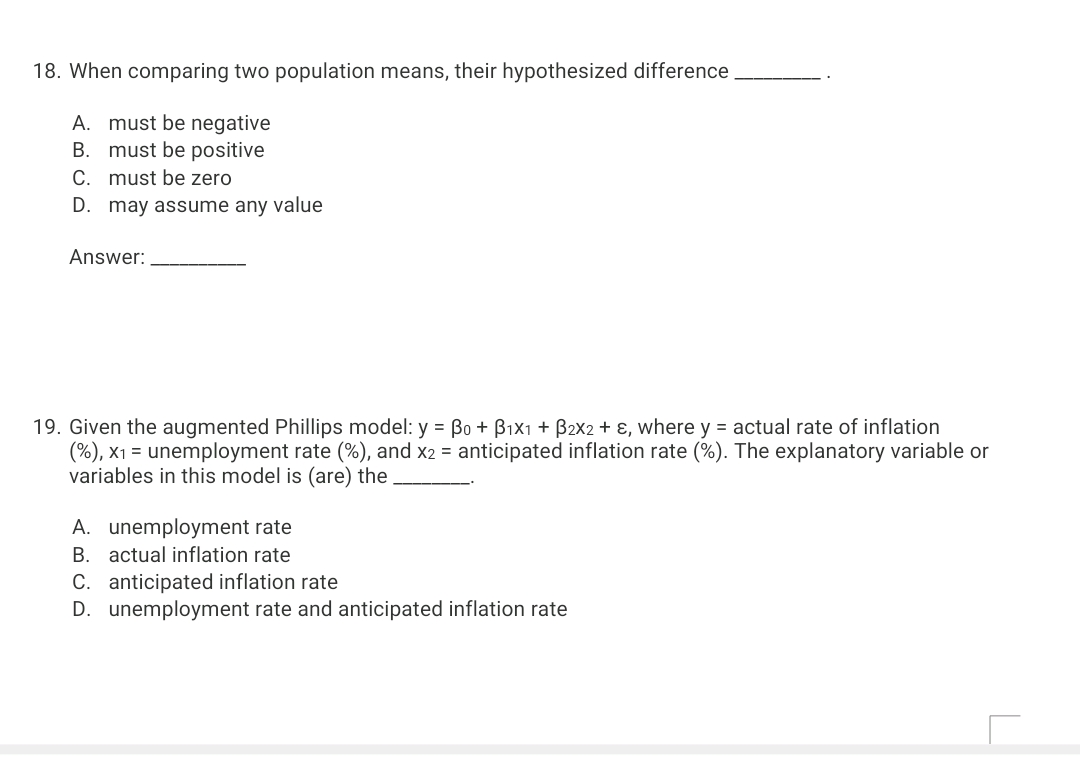
Transcribed Image Text:18. When comparing two population means, their hypothesized difference
A. must be negative
B. must be positive
C. must be zero
D. may assume any value
Answer:
19. Given the augmented Phillips model: y = Bo + Bix1 + B2x2 + ɛ, where y = actual rate of inflation
(%), x1 = unemployment rate (%), and x2 = anticipated inflation rate (%). The explanatory variable or
variables in this model is (are) the
A. unemployment rate
B. actual inflation rate
C. anticipated inflation rate
D. unemployment rate and anticipated inflation rate
Expert Solution
This question has been solved!
Explore an expertly crafted, step-by-step solution for a thorough understanding of key concepts.

This is a popular solution!

Trending now
This is a popular solution!

Step by step
Solved in 2 steps

Recommended textbooks for you
Linear Algebra: A Modern Introduction
Algebra
ISBN:
9781285463247
Author:
David Poole
Publisher:
Cengage Learning
Linear Algebra: A Modern Introduction
Algebra
ISBN:
9781285463247
Author:
David Poole
Publisher:
Cengage Learning