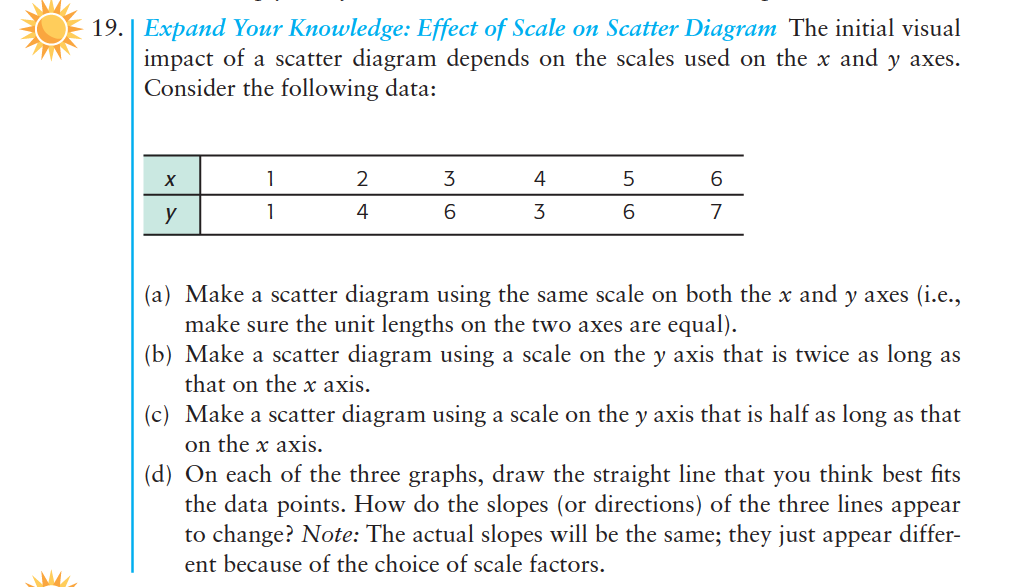
19. | Expand Your Knowledge: Effect of Scale on Scatter Diagram The initial visual impact of a scatter diagram depends on the scales used on the x and y axes. Consider the following data: 1 4 У 1 4 6. 3 (a) Make a scatter diagram using the same scale on both the x and y axes (i.e., make sure the unit lengths on the two axes are equal). (b) Make a scatter diagram using a scale on the y axis that is twice as long as that on the x axis. (c) Make a scatter diagram using a scale on the y axis that is half as long as that on the x axis. (d) On each of the three graphs, draw the straight line that you think best fits the data points. How do the slopes (or directions) of the three lines appear to change? Note: The actual slopes will be the same; they just appear differ- ent because of the choice of scale factors.


Unitary Method
The word “unitary” comes from the word “unit”, which means a single and complete entity. In this method, we find the value of a unit product from the given number of products, and then we solve for the other number of products.
Speed, Time, and Distance
Imagine you and 3 of your friends are planning to go to the playground at 6 in the evening. Your house is one mile away from the playground and one of your friends named Jim must start at 5 pm to reach the playground by walk. The other two friends are 3 miles away.
Profit and Loss
The amount earned or lost on the sale of one or more items is referred to as the profit or loss on that item.
Units and Measurements
Measurements and comparisons are the foundation of science and engineering. We, therefore, need rules that tell us how things are measured and compared. For these measurements and comparisons, we perform certain experiments, and we will need the experiments to set up the devices.
Solve task from image.


Trending now
This is a popular solution!

Step by step
Solved in 3 steps with 3 images


