19. The following matrix presents the results of a two- factor study with n = treatment conditions. Note that one of the treatment 10 scores in each of the six means is missing. Factor B B, B, M = 10 M = 20 | M = 40 A, Factor A A, M= 20 | M = 30 a. What value for the missing mean would result in no main effect for factor A? b. What value for the missing mean would result in no interaction? 20. A researcher conducts an independent-measures, two-factor study using a separate sample of n = 15 participants in each treatment condition. The results are evaluated using an ANOVA and the researther reports an F-ratio with df = 1, 84 for factor A, and an F-ratio with df = 2, 84 for factor B. a. How many levels of factor A were used in the study? b. How many levels of factor B were used in the study? c. What are the df values for the F-ratio evaluating B.
19. The following matrix presents the results of a two- factor study with n = treatment conditions. Note that one of the treatment 10 scores in each of the six means is missing. Factor B B, B, M = 10 M = 20 | M = 40 A, Factor A A, M= 20 | M = 30 a. What value for the missing mean would result in no main effect for factor A? b. What value for the missing mean would result in no interaction? 20. A researcher conducts an independent-measures, two-factor study using a separate sample of n = 15 participants in each treatment condition. The results are evaluated using an ANOVA and the researther reports an F-ratio with df = 1, 84 for factor A, and an F-ratio with df = 2, 84 for factor B. a. How many levels of factor A were used in the study? b. How many levels of factor B were used in the study? c. What are the df values for the F-ratio evaluating B.

Linear Algebra: A Modern Introduction
4th Edition
ISBN:9781285463247
Author:David Poole
Publisher:David Poole
Chapter2: Systems Of Linear Equations
Section2.4: Applications
Problem 2EQ: 2. Suppose that in Example 2.27, 400 units of food A, 500 units of B, and 600 units of C are placed...

Related questions

Concept explainers
Contingency Table
A contingency table can be defined as the visual representation of the relationship between two or more categorical variables that can be evaluated and registered. It is a categorical version of the scatterplot, which is used to investigate the linear relationship between two variables. A contingency table is indeed a type of frequency distribution table that displays two variables at the same time.
Binomial Distribution
Binomial is an algebraic expression of the sum or the difference of two terms. Before knowing about binomial distribution, we must know about the binomial theorem.
Topic Video
Question
19
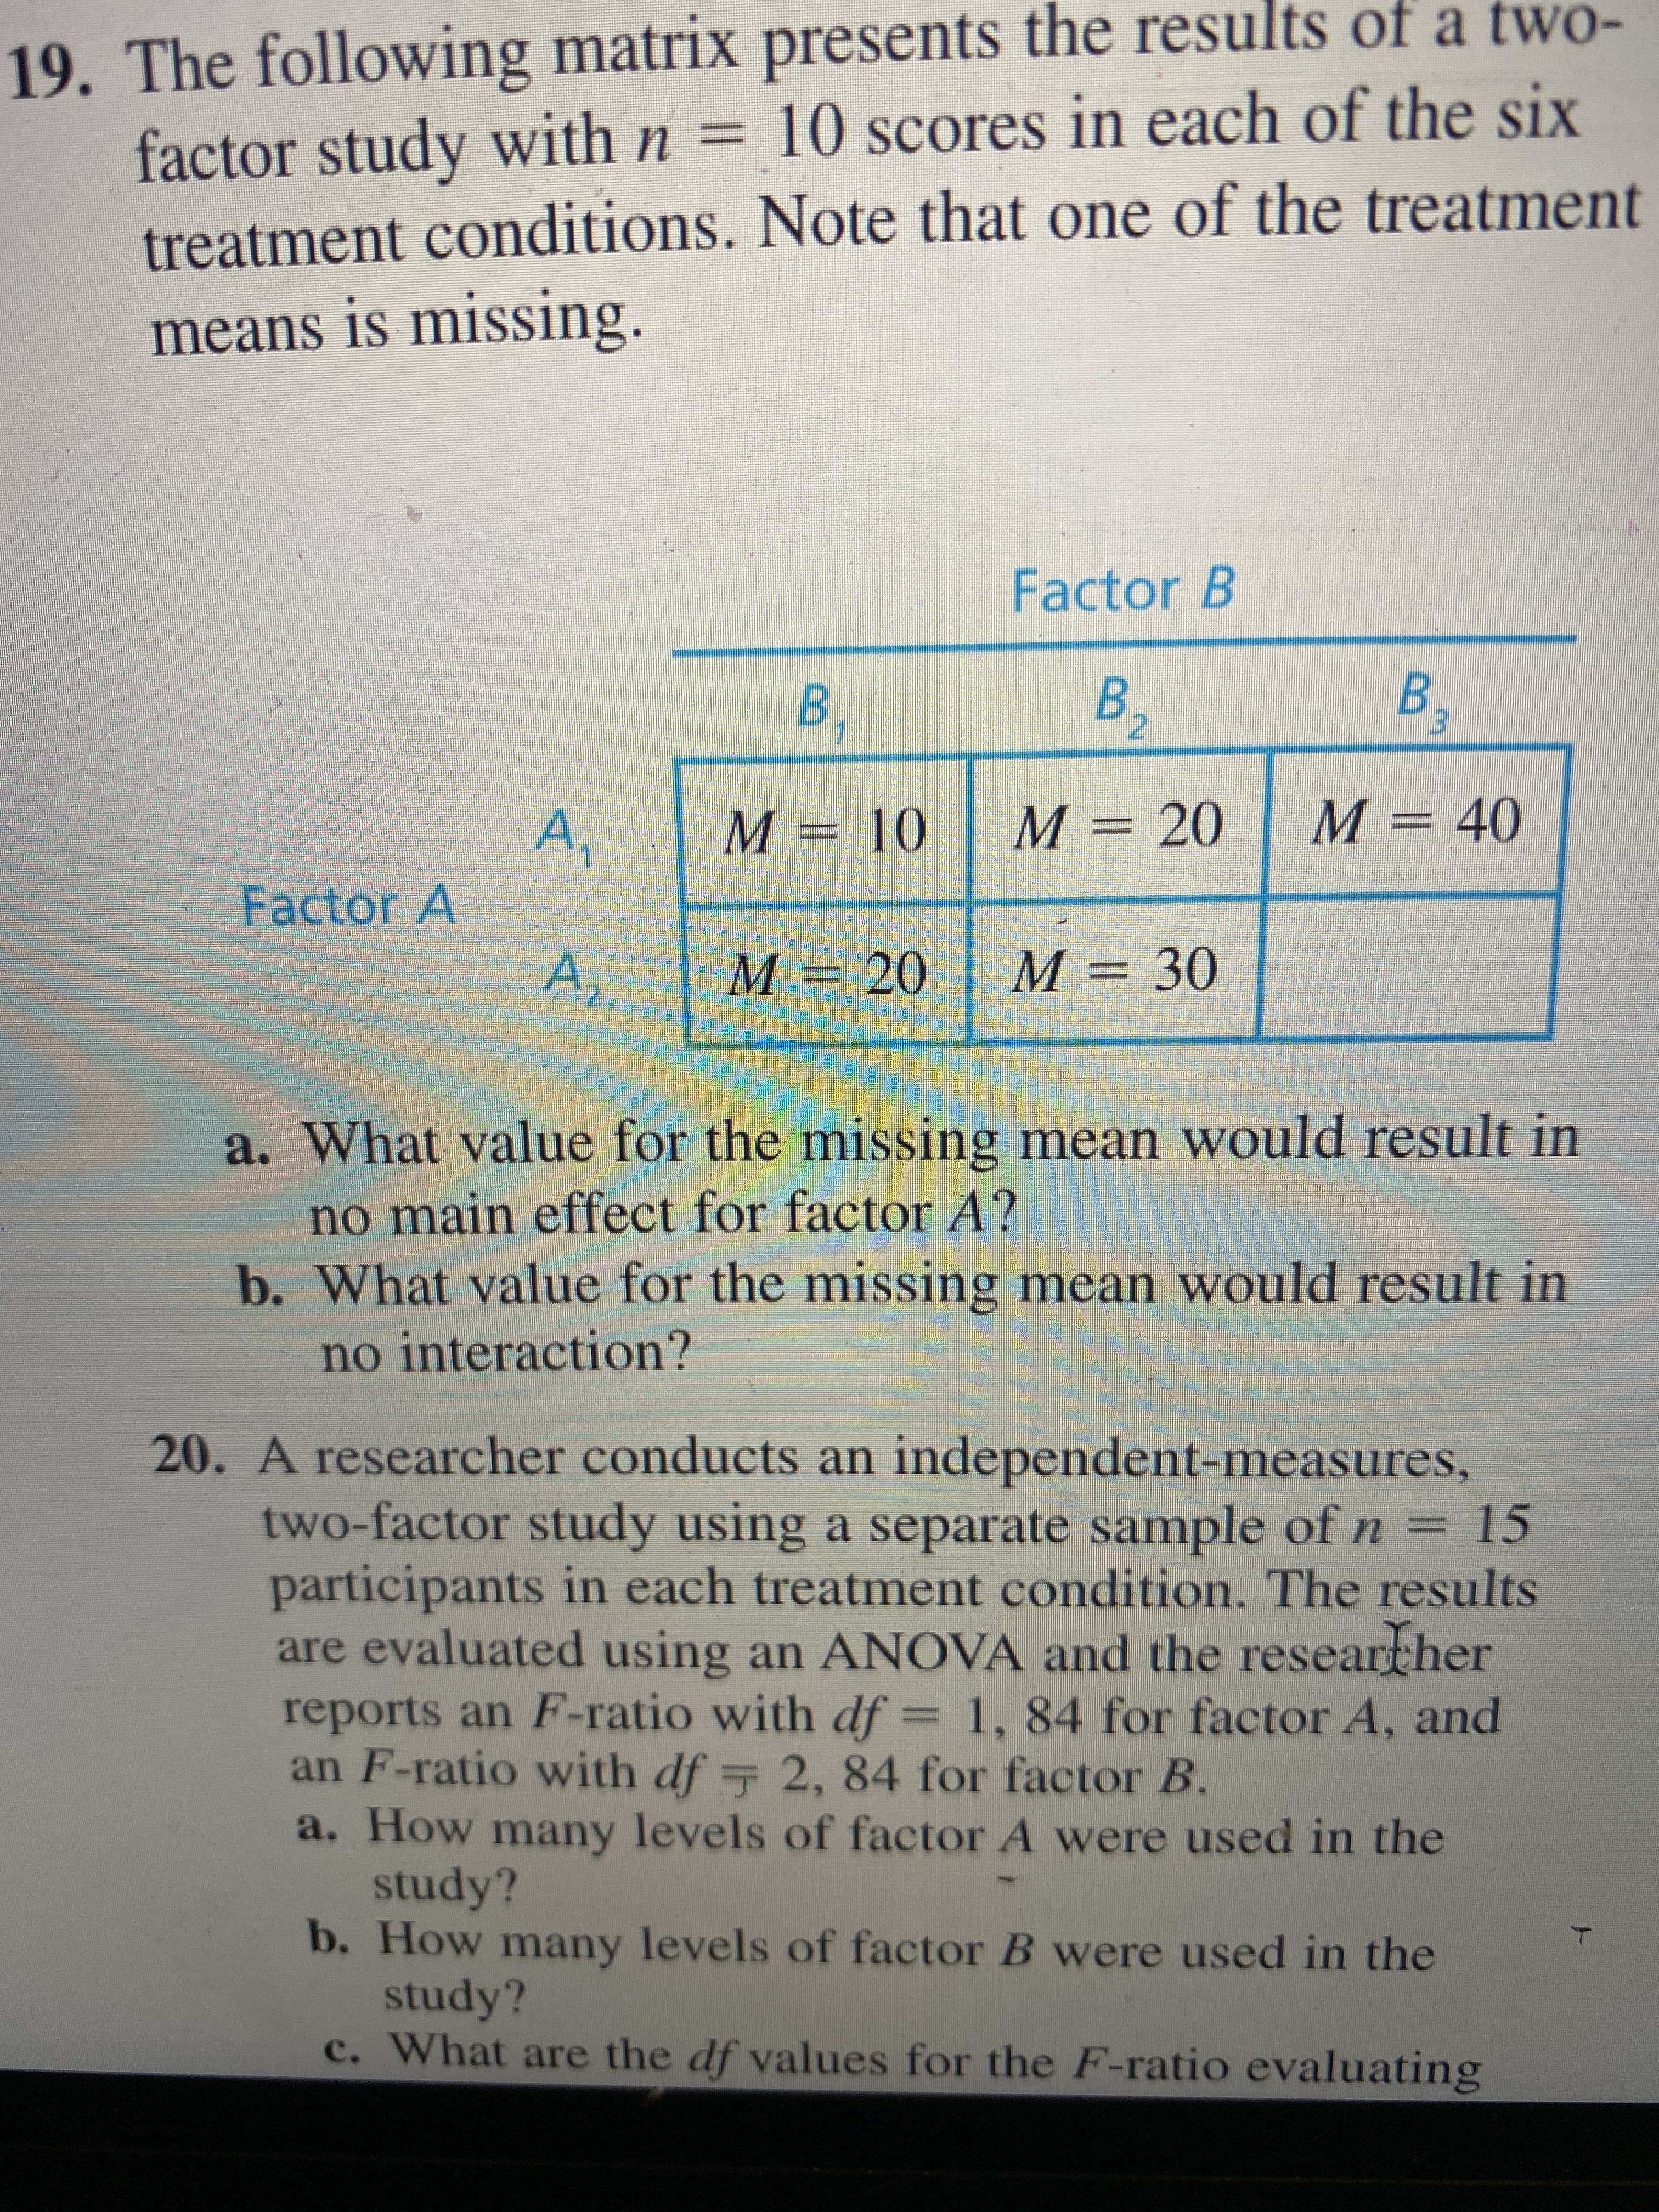
Transcribed Image Text:19. The following matrix presents the results of a two-
factor study with n =
treatment conditions. Note that one of the treatment
10 scores in each of the six
means is missing.
Factor B
B,
B,
M = 10
M = 20 | M = 40
A,
Factor A
A,
M= 20 | M = 30
a. What value for the missing mean would result in
no main effect for factor A?
b. What value for the missing mean would result in
no interaction?
20. A researcher conducts an independent-measures,
two-factor study using a separate sample of n = 15
participants in each treatment condition. The results
are evaluated using an ANOVA and the researther
reports an F-ratio with df = 1, 84 for factor A, and
an F-ratio with df = 2, 84 for factor B.
a. How many levels of factor A were used in the
study?
b. How many levels of factor B were used in the
study?
c. What are the df values for the F-ratio evaluating
B.
Expert Solution
This question has been solved!
Explore an expertly crafted, step-by-step solution for a thorough understanding of key concepts.

This is a popular solution!

Trending now
This is a popular solution!

Step by step
Solved in 2 steps with 2 images

Knowledge Booster


Learn more about
Need a deep-dive on the concept behind this application? Look no further. Learn more about this topic, statistics and related others by exploring similar questions and additional content below.Recommended textbooks for you
Linear Algebra: A Modern Introduction
Algebra
ISBN:
9781285463247
Author:
David Poole
Publisher:
Cengage Learning
Linear Algebra: A Modern Introduction
Algebra
ISBN:
9781285463247
Author:
David Poole
Publisher:
Cengage Learning