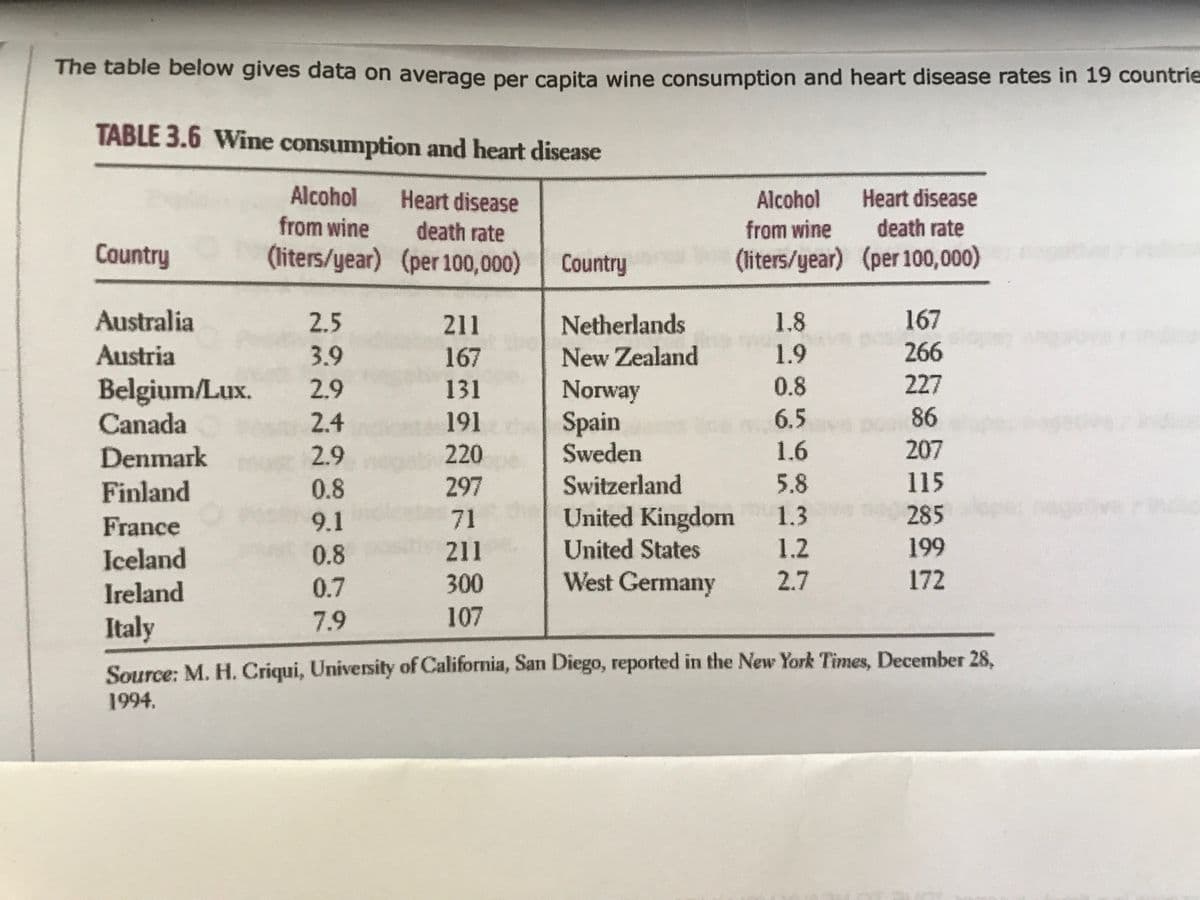
The table below gives data on average per capita wine consumption and heart disease rates in 19 countrie TABLE 3.6 Wine consumption and heart disease Heart disease death rate (liters/year) (per 100,000) Country Alcohol from wine Alcohol from wine (liters/year) (per 100,000) Heart disease death rate Country Australia 2.5 211 Netherlands 1.8 167 Austria 3.9 167 New Zealand 1.9 266 0.8 227 Belgium/Lux. Canada Denmark 2.9 131 Norway Spain Sweden 2.4 191 6.5 86 2.9 220 1.6 207 Finland 0.8 297 Switzerland 5.8 115 United Kingdom United States West Germany France 9.1 71 1.3 285 0.8 211 1.2 199 Iceland Ireland 0.7 300 2.7 172 Italy 7.9 107 Source: M. H. Criqui, University of California, San Diego, reported in the New York Times, December 28, 1994.


Angles in Circles
Angles within a circle are feasible to create with the help of different properties of the circle such as radii, tangents, and chords. The radius is the distance from the center of the circle to the circumference of the circle. A tangent is a line made perpendicular to the radius through its endpoint placed on the circle as well as the line drawn at right angles to a tangent across the point of contact when the circle passes through the center of the circle. The chord is a line segment with its endpoints on the circle. A secant line or secant is the infinite extension of the chord.
Arcs in Circles
A circular arc is the arc of a circle formed by two distinct points. It is a section or segment of the circumference of a circle. A straight line passing through the center connecting the two distinct ends of the arc is termed a semi-circular arc.
Attached


Trending now
This is a popular solution!

Step by step
Solved in 2 steps


