-2 1 2 -2 -1 0 1 2 -2 -1 0 1 -1 0 Theoretical Quantiles ANOVA ANOVA - math Sum of Squares Mean Square P prog 4002 2001.1 20.3 s.001 0.229 Residuals 13464 197 68.3 [3] Assumption Checks Homogeneity of Variances Test (Levene's) df1 dt2 ar2 1.05 107 0.350 [3) Q-Q Plot Theoretical Quantiles Normality Test (Shapiro-Wilk) Statistic 0.981 0.010 Post Hoc Comparisons - prog Standardized Residuals Standardized Residuals
-2 1 2 -2 -1 0 1 2 -2 -1 0 1 -1 0 Theoretical Quantiles ANOVA ANOVA - math Sum of Squares Mean Square P prog 4002 2001.1 20.3 s.001 0.229 Residuals 13464 197 68.3 [3] Assumption Checks Homogeneity of Variances Test (Levene's) df1 dt2 ar2 1.05 107 0.350 [3) Q-Q Plot Theoretical Quantiles Normality Test (Shapiro-Wilk) Statistic 0.981 0.010 Post Hoc Comparisons - prog Standardized Residuals Standardized Residuals

MATLAB: An Introduction with Applications
6th Edition
ISBN:9781119256830
Author:Amos Gilat
Publisher:Amos Gilat
Chapter1: Starting With Matlab
Section: Chapter Questions
Problem 1P

Related questions
Question
100%
What do you conclude from this one way ANOVA? Write in APA format
![-2
-2
-1
1
2
-2 -1 0
1 2
1
Theoretical Quantiles
ANOVA
ANOVA - math
Sum of Squares
Mean S quare
df
P
n
prog
4002
2001.1
29.3
<.001
0.220
Residueles
13464
197
68.3
(31
Assumption Checks
Homogeneity of Variances Test (Lovene's)
F
df1
d12
1.05
2
197
0.350
[3]
Q-Q Plot
Theoretical Quantiles
Normality Test (Shapiro-Wilk)
Statistic
0.981
0.010
Post Hoc Comparisons - prog
Comparison
prog
prog
Mean Difference
SE
df
t
Ptukey Cohen's d
-6.71
1.47
197
-4.56
<.001
-0.812
3
3.60
1.70
197
2.12
0.088
0.436
2
3
10.31
1.42
197
7.26
<.001
1.248
Note. Comparisons are based on estimated marginal means
Standardized Residuals
Standardized Residuals](/v2/_next/image?url=https%3A%2F%2Fcontent.bartleby.com%2Fqna-images%2Fquestion%2F374b2cbe-8e64-4a21-8ce2-c13d10d5d8f6%2Fdc887e97-6b2d-4ced-a3ae-de83004c390b%2Fge53ti_processed.jpeg&w=3840&q=75)
Transcribed Image Text:-2
-2
-1
1
2
-2 -1 0
1 2
1
Theoretical Quantiles
ANOVA
ANOVA - math
Sum of Squares
Mean S quare
df
P
n
prog
4002
2001.1
29.3
<.001
0.220
Residueles
13464
197
68.3
(31
Assumption Checks
Homogeneity of Variances Test (Lovene's)
F
df1
d12
1.05
2
197
0.350
[3]
Q-Q Plot
Theoretical Quantiles
Normality Test (Shapiro-Wilk)
Statistic
0.981
0.010
Post Hoc Comparisons - prog
Comparison
prog
prog
Mean Difference
SE
df
t
Ptukey Cohen's d
-6.71
1.47
197
-4.56
<.001
-0.812
3
3.60
1.70
197
2.12
0.088
0.436
2
3
10.31
1.42
197
7.26
<.001
1.248
Note. Comparisons are based on estimated marginal means
Standardized Residuals
Standardized Residuals
Transcribed Image Text:ROGERS
1:13 PM
9 57%
...
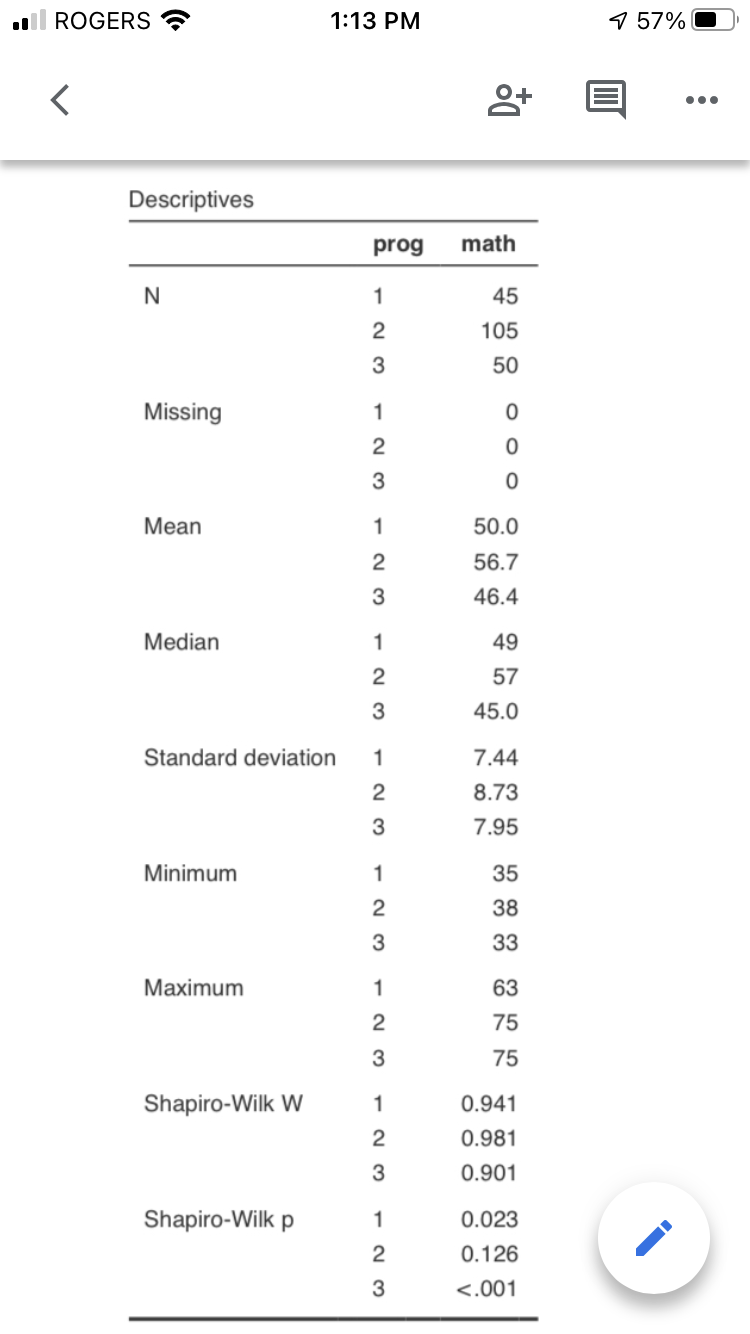
Descriptives
prog
math
1
45
2
105
50
Missing
1
Мean
1
50.0
56.7
3
46.4
Median
1
49
2
57
3
45.0
Standard deviation
1
7.44
2
8.73
7.95
Minimum
1
35
2
38
3
33
Maximum
1
63
75
75
Shapiro-Wilk W
1
0.941
2
0.981
3
0.901
Shapiro-Wilk p
1
0.023
2
0.126
3
<.001
Expert Solution
This question has been solved!
Explore an expertly crafted, step-by-step solution for a thorough understanding of key concepts.

Step by step
Solved in 3 steps

Recommended textbooks for you
MATLAB: An Introduction with Applications
Statistics
ISBN:
9781119256830
Author:
Amos Gilat
Publisher:
John Wiley & Sons Inc

Probability and Statistics for Engineering and th…
Statistics
ISBN:
9781305251809
Author:
Jay L. Devore
Publisher:
Cengage Learning

Statistics for The Behavioral Sciences (MindTap C…
Statistics
ISBN:
9781305504912
Author:
Frederick J Gravetter, Larry B. Wallnau
Publisher:
Cengage Learning
MATLAB: An Introduction with Applications
Statistics
ISBN:
9781119256830
Author:
Amos Gilat
Publisher:
John Wiley & Sons Inc
Probability and Statistics for Engineering and th…
Statistics
ISBN:
9781305251809
Author:
Jay L. Devore
Publisher:
Cengage Learning
Statistics for The Behavioral Sciences (MindTap C…
Statistics
ISBN:
9781305504912
Author:
Frederick J Gravetter, Larry B. Wallnau
Publisher:
Cengage Learning

Elementary Statistics: Picturing the World (7th E…
Statistics
ISBN:
9780134683416
Author:
Ron Larson, Betsy Farber
Publisher:
PEARSON

The Basic Practice of Statistics
Statistics
ISBN:
9781319042578
Author:
David S. Moore, William I. Notz, Michael A. Fligner
Publisher:
W. H. Freeman

Introduction to the Practice of Statistics
Statistics
ISBN:
9781319013387
Author:
David S. Moore, George P. McCabe, Bruce A. Craig
Publisher:
W. H. Freeman