random sample of 144 recent donations at a certain blood bank reveals that 89 were type A blood. Does this suggest that the actual percentage of type A donations differs from 40%, the percentage of the population having type A blood? Carry out a test of the appropriate hypotheses using a significance level of 0.01. State the appropriate null and alternative hypotheses. H0: p = 0.40 Ha: p < 0.40H0: p = 0.40 Ha: p > 0.40 H0: p ≠ 0.40 Ha: p = 0.40H0: p = 0.40 Ha: p ≠ 0.40 Calculate the test statistic and determine the P-value. (Round your test statistic to two decimal places and your P-value to four decimal places.) z = P-value = State the conclusion in the problem context. Reject the null hypothesis. There is sufficient evidence to conclude that the percentage of type A donations differs from 40%.Reject the null hypothesis. There is not sufficient evidence to conclude that the percentage of type A donations differs from 40%. Do not reject the null hypothesis. There is sufficient evidence to conclude that the percentage of type A donations differs from 40%.Do not reject the null hypothesis. There is not sufficient evidence to conclude that the percentage of type A donations differs from 40%.


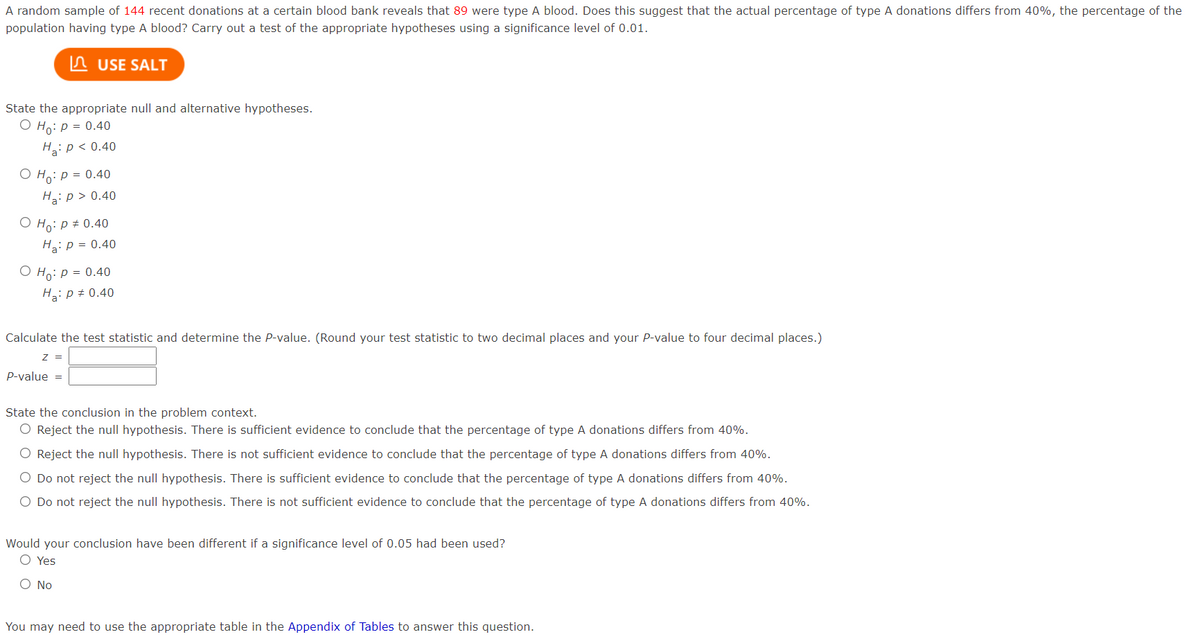
A random sample of 144 recent donations at a certain blood bank reveals that 89 were type A blood. Does this suggest that the actual percentage of type A donations differs from 40%, the percentage of the population having type A blood? Carry out a test of the appropriate hypotheses using a significance level of 0.01.
State the appropriate null and alternative hypotheses.
Ha: p < 0.40H0: p = 0.40
Ha: p > 0.40 H0: p ≠ 0.40
Ha: p = 0.40H0: p = 0.40
Ha: p ≠ 0.40
Calculate the test statistic and determine the P-value. (Round your test statistic to two decimal places and your P-value to four decimal places.)
| z | = | |
| P-value | = |
State the conclusion in the problem context.
Would your conclusion have been different if a significance level of 0.05 had been used?
You may need to use the appropriate table in the Appendix of Tables to answer this question.
We have given that
Sample size n =144
Favorable cases x=89
Sample proportion p^=x/n
=89/144
=0.6181

Trending now
This is a popular solution!

Step by step
Solved in 2 steps


