2 22.11. In a report on consumer preference, it was given that out of 500 persons surveyed, 400 preferred variety A, 380 preferred variety B and 270 liked both A and B. Are the data consistent ? 31
2 22.11. In a report on consumer preference, it was given that out of 500 persons surveyed, 400 preferred variety A, 380 preferred variety B and 270 liked both A and B. Are the data consistent ? 31

Glencoe Algebra 1, Student Edition, 9780079039897, 0079039898, 2018
18th Edition
ISBN:9780079039897
Author:Carter
Publisher:Carter
Chapter4: Equations Of Linear Functions
Section4.5: Correlation And Causation
Problem 24PFA

Related questions
Question
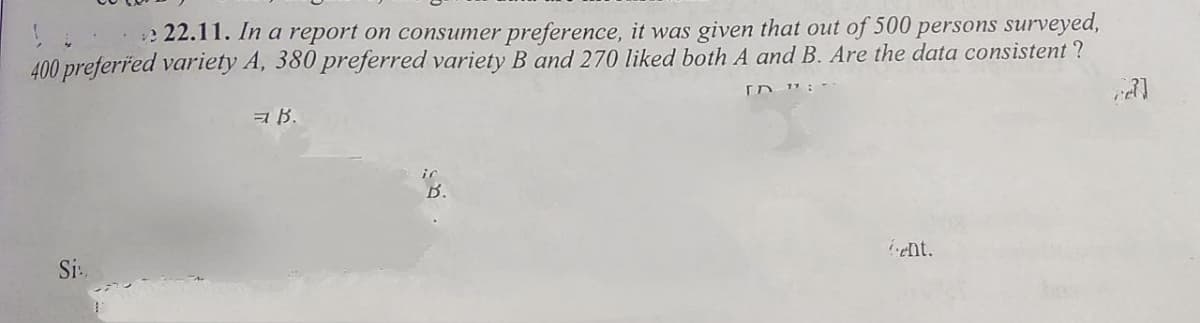
Transcribed Image Text:e 22.11. In a report on consumer preference, it was given that out of 500 persons surveyed,
400 preferřed variety A, 380 preferred variety B and 270 liked both A and B. Are the data consistent ?
a B.
ir
B.
ent.
Si
Expert Solution
This question has been solved!
Explore an expertly crafted, step-by-step solution for a thorough understanding of key concepts.

Step by step
Solved in 2 steps with 2 images

Recommended textbooks for you
Glencoe Algebra 1, Student Edition, 9780079039897…
Algebra
ISBN:
9780079039897
Author:
Carter
Publisher:
McGraw Hill
Glencoe Algebra 1, Student Edition, 9780079039897…
Algebra
ISBN:
9780079039897
Author:
Carter
Publisher:
McGraw Hill