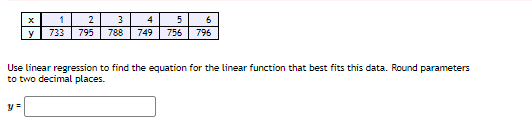
2 3 4 5 6 733 795 788 749 756 796 Use linear regression to find the equation for the linear function that best fits this data. Round parameters to two decimal places.


Q: 1 2.5 4.4 2 13.6 4 20.7 4 25.6 36.2 Using the data transformation in the nonlinear regression…
A: Consider the given table.The given table is as follows.
Q: X 1 2 3 4 5 6 y 814 763 840 812 867 829 Use linear regression to find the equation for the linear…
A: Find the linear function using linear regression
Q: Day of week Number of toys 1 4 5 6 14 24 35 47 53 67 Use linear regression to find the equation for…
A: From given data, X Y X*Y X*X 1 14 14 1 2 24 48 4 3 35 105 9 4 47 188 16 5 53 265 25 6…
Q: Use a graphing calculator to find a linear regression model for the men's 100-meter freestyle data…
A: The given data represents 100-meter freestyle winning time data for men and women form 1980 to 2008.…
Q: Residual Plot 20 24 20 40 100 10 15 20 Order (Time) Linear regression models rely on four important…
A: Linear Regression Model's rely on four important assumptions ("LINE") 1) L - Linearity The…
Q: The President _of the Farmers Association _wants to know how the amount of fertilizer and the amount…
A: The independent variables are water and fertilizer. The dependent variable is growth. We have to…
Q: Need help with entirety of the problem.
A: Solution: Given data represents the end-of-year assets in billions of dollars for the Medicare…
Q: X y 1 2 3 825 1202 1509 4 5 2138 2850 6 4034 Use linear regression to find the equation for the…
A: Find the man of x and y and then go ahead.
Q: a) Use software to find the multiple linear regression equation. Enter the coefficients rounded to 4…
A: We perform regression using the step by step procedure in excel as, Enter the values into excel…
Q: The population of a country is expected to drop by 30% over the next 50 years as the percent of its…
A: Output:In Excel, enter the data in cells A1 to A7 (t) and B1 to B7 (P); the first row is for…
Q: f. The equation of the linear regression line is: (Please show your answers to two decimal places)
A: The given data shows the time on the phone and weight for 8 women.
Q: Data is collected on teacher salary (measured in 1000’s of $’s) and years of service, rating by the…
A: Given Data is collected on teacher salary (measured in 1000’s of $’s) and years of service, rating…
Q: Day of week 1 2 6 93 106 3 4 5 Number of toys 25 41 58 74 Use linear regression to find the equation…
A: Introduction: Consider that x is the independent variable and y is the dependent variable. The size…
Q: The President of the Farmers Association wants to know how the amount of fertilizer and the amount…
A: Hi! Thank you for the question, as per the honor code, we are allowed to answer three sub-parts at a…
Q: ndependent variable. P(x) = Ox? +Ox+O (Round the constant to four decimal places as needed. Round…
A: Note: As per bartleby instruction when more then three questions for subpart is given only three…
Q: x 1 2 3 4 5 6 y 709 711 780 798 753 817 Use linear regression to find the equation for the linear…
A: From given data, X Y X*Y X*X 1 709 709 1 2 711 1422 4 3 780 2340 9 4 798 3192 16 5 753…
Q: A cup of soup is left on a countertop to cool. The table below gives the temperatures, in degrees…
A: The independent variable is Time in Minutes. The dependent variable is Temperature in F. We have to…
Q: 3 y 802 | 1350 2228 | 3602 5882 9604 2 4 6. se linear regression to find the equation for the linear…
A: Given Data: X Y 1 802 2 1350 3 2228 4 3602 5 5882 6 9604 To find the equation for…
Q: Use least squares to find a linear regression equation Bo + B1x = y for the data shown in the table…
A: We need to find the regression line in the given form β0+β1x=y for the data given in the table X…
Q: The linear regression equation for a data set is ŷ - 4.1 + 1.6x. The actual value at x = 5 is 7.1.…
A:
Q: x 1 2 3 4 5 6 y 564 3529 10748 21398 40174 60152 Use linear regression to find the equation for…
A: Given information: x 1 2 3 4 5 6 y 564 3529 10748 21398 40174 60152
Q: y 733 1 2 749 756 4 795 779 6 778 Use linear regression to find the equation for the linear function…
A: From the given information, Consider, The data is as shown below: x y 1 733 2 749 3 756…
Q: Ozone (O3) is a major component of air pollution in many cities. Atmospheric ozone levels are…
A: Hey there! Thank you for posting the question. Since your question has more than 3 parts, we are…
Q: 10.2.19-T Question Help Find the regression equation, letting the first variable be the predictor…
A: Solution: It is required to find the linear regression equation for the given data. Let x be the…
Q: 5. (a) Why is simple linear regression important? Distinguish between linear regression and…
A:
Q: Use a graphing calculator to find a linear regression model for the men's 100-meter freestyle data…
A: Here we will calculate the linear regression model,
Q: 3 4 6. y 900 1296 1810 2661 3676 5740 Use linear regression to find the equation for the linear…
A: Construct a table for the given data. x y xy x2 1 900 900 1 2 1296 2592 4 3 1810 5430 5 4…
Q: 1 2 3 4 1064 1547 2247 3045 4161 5929 Use linear regression to find the equation for the linear…
A:
Q: 4. 754 758 784 846 833 Use linear regression to find the equation for the linear function that best…
A:
Q: The US Box Office Gross profit was recorded for the first eleven weekends after the release of a…
A: In this case, Weekend (x) is the independent variable and US Gross (y) is the dependent variable.
Q: Part 5 of 6 (e) Find the equation of the regression line and draw the line on the scatter plot.…
A: e) Step-by-step procedure to draw the fitted line plot using Excel: In Excel sheet, enter and…
Q: 1. Which quantity is the independent variable? O average mid-career salary of graduates O annual…
A:
Q: 5. Catalogues listing text books were examined to discover the relationship between the cost of a…
A: Since the approximate price (i.e., the dependent variable) is to be estimated for a specified page…
Q: x 1 2 3 4 5 6 y 749 6815 23733 57763 121692 220319 Use linear regression to find the equation for…
A: From excel following regression output can be obtained.
Q: x y 1 771 2 760 3 787…
A: To find the equation for the linear function that best fits the given data.
Q: 1. Which quantity is the independent variable? average mid-career salary of graduates O annual…
A: here compare given regression model with standard regreesion equation
Q: 2. 3 4 5 y 644 742 916 1119 1354 1590 Use regression to find an exponential equation that best fits…
A:
Q: The table below show data that has been collected from different fields from various farms in a…
A: Given: Grams (X) Vitamin C (Y) 55 12 65 15.9 75 20.3 85 25.3 95 30.3 105 33.6 115…
Q: 1 4 5 6 y 676 666 704 774 768 817 Use linear regression to find the equation for the linear function…
A:
Q: The y-intercept in a linear regression model is always relevant and of interest to investigators for…
A: Here we want to know given statement is True or not.
Q: X 1 3. 4 5. 6. y 673 722 693 721 728 787 Use linear regression to find the equation for the linear…
A: Given the data for various values of x and y. We need to find the equation for the linear function…
Q: 6. У 724 771 780 781 780 795 Use linear regression to find the equation for the linear function that…
A:
Q: 2 3 4 5 6 y 605 4127 | 14213 31129 58232 102967 Use linear regression to find the equation for the…
A: The data is given as follows. x y 1 605 2 4127 3 14213 4 31129 5 58232 6 102967
Q: GMAT 300 300 270 280 360 280 GPA 3.7 3.1 3.1 3.2 3.8 2.9 A linear regression on the data gives the…
A: The data is as follows GMAT GPA 300 3.7 300 3.1 270 3.1 280 3.2 360 3.8 280 2.9…
Q: Q.1 The Conference Board produces a Consumer Confidence Index (CCI) that reflects people’s feelings…
A: Since we only answer up to 3 sub-parts, I'll answer 1st 3 parts. Please resubmit the question for…
Q: 1 2 3 4 5 6. 1707 2879 7870 13674 y 971 4713 Use linear regression to find the equation for the…
A: Given: The values of X and Y.
Q: 1 2 3 4 5 6 793 8538 32230 90132 188700 350742 Use linear regression to find an linear function that…
A:
Q: Five students took an aptitude test prior to their algebra course. What linear regression…
A: Ans . X Y X-Mx Y-My (X - Mx)2 (X - Mx)(Y - My) 9585807060 8595706570 1772-8-18 818-7-12-7…
Q: 1. 2 3 4 6. y 882 1551 2445 4173 6378 11331 Use linear regression to find the equation for the…
A:

Step by step
Solved in 2 steps with 1 images

- XYZ Corporation Stock Prices The following table shows the average stock price, in dollars, of XYZ Corporation in the given month. Month Stock price January 2011 43.71 February 2011 44.22 March 2011 44.44 April 2011 45.17 May 2011 45.97 a. Find the equation of the regression line. Round the regression coefficients to three decimal places. b. Plot the data points and the regression line. c. Explain in practical terms the meaning of the slope of the regression line. d. Based on the trend of the regression line, what do you predict the stock price to be in January 2012? January 2013?Zipfs Law The following table shows U.S cities by rank in terms of population and population in thousands. City Rank r Population N New York 1 8491 Chicago 3 2722 Philadelphia 5 1560 Dallas 9 1280 Austin 11 913 San Francisco 13 852 Columbus 15 836 A rule known as Zipfs law tells us that it is reasonable to approximate these data with a power function. a Use power regression to express the population as a function of the rank. b Plot the data along with the power function from part a. c Phoenix is the sixth largest city in the United States. Use your answer from part a to estimate population of Phoenix. Round your answer in thousands to the nearest whole number. Note: The actual population is 1537 thousand.Special Rounding Instructions For this exercise set, round all regression parameters to three decimal places, but round all other answers to two decimal places unless otherwise indicated. Gray Wolves in WisconsinGray wolves were among the first mammals protected under the Endangered Species Act in the 1970s. Wolves recolonized in Wisconsin beginning in 1980.Their population grew reliably after 1985 as follows: Year Wolves Year Wolves 1985 15 1993 40 1986 16 1994 57 1987 18 1995 83 1988 28 1996 99 1989 31 1997 145 1990 34 1998 178 1991 40 1999 197 1992 45 2000 266 a. Explain why an exponential model may be appropriate. b. Are these data exactly exponential? Explain. c. Find an exponential model for these data. d. Plot the data and the exponential model. e. Comment on your graph in part d. Which data points are below or above the number predicted by the exponential model?
- Special Rounding Instructions For this exercise set, round all regression parameters to three decimal places, but round all other answers to two decimal places unless otherwise indicated. Postal RatesThe table below shows the cost s, in cents, of a domestic first-class postage stamp in the United States tyears after 1900. t=time,inyearssince1900 s=costofstamp 19 2 32 3 58 4 71 8 78 15 85 22 95 32 102 37 109 44 116 47 a.Use exponential regression to model s as an exponential function of t. b.What cost does your model give for a 1988 stamp? Report your answer to the nearest cent. The actual cost was 25cents. c.Plot the data and the exponential model.A Dubious Model of Oil Prices The following table shows the prices of oil in U.S. dollars per barrel, t years since 1990, One analysis involving additional data used a cubic equation to model this data. t Years since 1990 0 2 5 7 10 12 15 17 20 21 P Price, dollars per barrel 18.91 16.22 16.63 18.20 27.04 23.47 49.63 69.04 77.46 106.92 a. Use cubic regression to model these data. Round the regression parameters to four decimal places. b. Plot the data along with the cubic model. c. In the analysis mentioned above, the graph is expanded through 2020. Expand the viewing window to show the model from 1990 to 2020. d. What estimate does the model give for oil prices in 2015? e. The actual price of oil in December of 2015 was about 35 per barrel. What basic principle in the use of models would be violated in relying on the estimate in part d?Special Rounding Instructions For this exercise set, round all regression parameters to three decimal places, but round all other answers to two decimal places unless otherwise indicated. Design Patents The following table shows the number P of design patents awarded by the U.S. Patents and Trademark Office from 1950 through 2010. t = years since 1950 P = patents 0 4718 10 2543 20 3214 30 3949 40 8024 50 17,413 60 22,799 a.Use exponential regression to model P as a function of t. b.Plot the data along with the regression equation. c.In what years were there more patents awarded than might be expected from the model?
- A regression was run to determine whether there is arelationship between the diameter of a tree (x, in inches) and the tree’s age (y, in years). Theresults of the regression are given below. Use this topredict the age of a tree with diameter 10 inches. y=ax+ba=6.301b=1.044r=0.970The following fictitious table shows kryptonite price, in dollar per gram, t years after 2006. t= Years since 2006 0 1 2 3 4 5 6 7 8 9 10 K= Price 56 51 50 55 58 52 45 43 44 48 51 Make a quartic model of these data. Round the regression parameters to two decimal places.Olympic Pole Vault The graph in Figure 7 indicates that in recent years the winning Olympic men’s pole vault height has fallen below the value predicted by the regression line in Example 2. This might have occurred because when the pole vault was a new event there was much room for improvement in vaulters’ performances, whereas now even the best training can produce only incremental advances. Let’s see whether concentrating on more recent results gives a better predictor of future records. (a) Use the data in Table 2 (page 176) to complete the table of winning pole vault heights shown in the margin. (Note that we are using x=0 to correspond to the year 1972, where this restricted data set begins.) (b) Find the regression line for the data in part ‚(a). (c) Plot the data and the regression line on the same axes. Does the regression line seem to provide a good model for the data? (d) What does the regression line predict as the winning pole vault height for the 2012 Olympics? Compare this predicted value to the actual 2012 winning height of 5.97 m, as described on page 177. Has this new regression line provided a better prediction than the line in Example 2?


